Original Articles: 2021 Vol: 13 Issue: 1
Simultaneous Spectrophotometric Estimation of Etamsylate and Mefenamic Acid in Presence of Etamsylate Main Impurities (Hydroquinone)
Ahmed Mohammed Al-Ghani1*, Anes Thabit Alabsi2, Nabil Albaser3
1Pharmaceutical Chemistry Department, Faculty of Medical Sciences, Al-Razi University, Sanaa, Yemen
2Pharmaceutics Department, Faculty of Medical Sciences, Al-Razi University, Sanaa, Yemen.
3Pharmacology Department, Faculty of Medical Sciences, Al-Razi University, Sanaa, Yemen
Abstract
Background: Etamsylate (ETS), a haemostatic drug, is formulated with mefenamic acid (MFA) for pain relief.
Objective: The aim of this work was to develop simple, precise and accurate spectrophotometric method for the estimation of ETS and MFA in presence of etamsylate main impurity (hydroquinone). This method could be used in routine analysis in quality control laboratories.
Methods: The two chemometric techniques include principal component regression (PCR) and partial least square (PLS) were prepared using synthetic mixture containing two drugs and hydroquinone all dissolved in methanol. In PCR and PLS the absorbance of the synthetic mixture in the range 225-235 nm with interval Δλ=0.5 nm in their zero-order spectra were selected. Calibration or regression was then obtained by using the absorbance data matrix and the concentration data matrix for the determination of the unknown concentrations of ETS and MFA in presence of ETS main impurities in laboratory prepared mixtures and in pharmaceutical dosage form.
Results: The two developed technique were successfully applied for analysis of the two drugs in laboratory prepared mixture and in dosage form with good recoveries percent in the range of 98-102%. Method validation was conducted according to ICH guidelines.
Conclusion: The developed methods were applied for the determination of the cited drugs in laboratory prepared mixtures and in tablet containing the two drugs. The methods are simple and precise and can be used for routine analysis of the drugs in combined dosage forms in quality control laboratories.
Keywords
Chemometric; Etamsylate; Hydroquinone; Mefenamic acid; Partial least squares; Principal component regression;Validation
Introduction
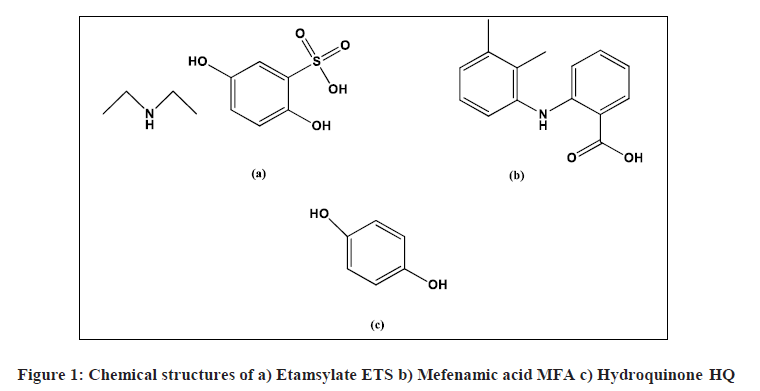
Etamsylate (ETS, Figure 1a) is 2, 5-dihydroxybenzenesulphonic acid-N-ethylethanamine. It is a haemostatic agent that maintains the stability of the capillary wall and corrects abnormal platelets adhesion. It is administered for the prophylaxis and control of haemorrhage from small blood vessels [1]. Mefenamic acid (MFA, Figure 1b) is 2-(2, 3- dimethylphenyl) aminobenzoic acid. MFA is a nonsteroidal anti-inflammatory drug of the anthranilic acid derivative class. It is used in mild to moderate pain including headache, dental pain, postoperative and postpartum pain and dysmenorrhoea, in musculoskeletal and joint disorders such as osteoarthritis and rheumatoid arthritis and in menorrhagia [1]. Hydroquinone (HQ, Figure 1c) is 1,4-dihydroxybenzene reported in the BP as a degradation product and the main impurity of ETS [2].Recently, ETS and MFA combination has been established as a dosage form that has a significant activity against paenstruation.
Literature review shows that several analytical methods were reported for the spectrophotometric determination of ETS in pharmaceutical preparations and biological fluids. These methods comprise spectrophotometric, florometric and multivariate [3-13], voltammetry [14], electrochemical [15-18], High Performance Thin Layer Chromatography (HPTLC) [19], High Performance Liquid Chromatography (HPLC) [20-25] and capillary electrophoresis [26-27]. Other methods were developed to determination of ETS in combination with MFA which include spectrophotometry [28-29], High Performance Thin Layer Chromatography (HPTLC) [30-31], and High Performance Liquid Chromatography (HPLC) [31-34].
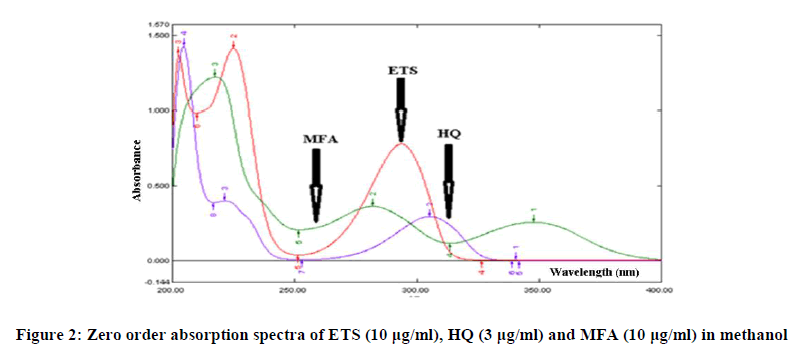
The zero order UV absorption spectra of ETS, HQ and MFA in methanol at their nominal concentrations ratio in pharmaceutical dosage form shows strong overlap (Figure 2). Thus, direct simultaneous spectrophotometric determination of the two drugs in presence the main impurities (HQ) of ETS in the mixture is not feasible. Therefore, the main task of this study was to develop and validate simple, accurate, and selective methods based on spectrophotometric measurements and capable of determining the two drugs in presence the main impurities (HQ) of ETS product simultaneously with the help of different chemometric techniques.
In recent years, multivariate calibrations, such as Principal Component Regression (PCR) and partial least square (PLS) started to be applied to the analysis of the analytical data obtained in all the instrumentations. The same methods and their algorithms have been applied to the simultaneous spectrophotometric determination of drugs in the pharmaceutical formulation containing two or more compounds with overlapping spectra. The main advantages of these techniques are the higher speed of processing data concerning the values of concentrations and absorbance of compounds with strongly overlapping spectra. Besides, the errors of calibration model are minimized by measuring the absorbance values at many points in the wavelength range of the zero-order and derivative spectra. Analytical methods using multivariate calibrations and their applications include the spectrophotometric, chromatographic and electrochemical methods for determinations of analytes in the mixtures [35].
In this part, the chemometric methods applied are PCR and PLS using factor analysis then using a subset of the resulting factors to complete the regression modeling [36]. These multivariate calibrations were useful in spectral analysis because the simultaneous inclusion of many spectral wavelengths instead of single wavelength greatly improved the precision and predictive ability [36].
Experimental Section
Materials and Solvents
ETS and MFA pharmaceutical standard substances were supplied by Quality Control Lab-Ministry of Health- Sana’a, Yemen, with certified purities of 100.35% and 99.77%, respectively. Hydroquinone standard substance was purchased from El-Nasr Pharmaceutical Chemicals, Co, Cairo, Egypt. Sylate M® tablets were manufactured by Shweiz (Emcure Pharmaceuticals Ltd, India, Batch No.SKT6112, each tablet claims to contain 500 mg ETS and 500 mg MFA).Methanol used was of analytical grade.
Instrumentation
Shimadzu ultraviolet/visible spectrophotometer 1600 (Japan) connected to an IBM compatible computer and supported with UV probe software version 2.21 was used. The chemometric methods, CFBP-ANN, and data analysis were performed using Matlab™ software, version 7.9.0 with PLS-toolbox 2.0 and neural networks toolbox.
Preparation of Stock and Working Standard Solutions Stock Solutions
Accurately weighed 100 mg of ETS, 100 mg of MFA and 20 mg of HQ were separately transferred into three 100 ml volumetric flasks, dissolved in and completed to volume with methanol to produce stock solutions of (1 mg/ml), (1 mg/ml) and (0.2 mg/ml), respectively.
Working Solutions
Accurate aliquots (10 ml) were transferred from each stock solution into three separate 100 ml volumetric flasks. The volume was completed with methanol to obtain working solutions of (100 μg/ml), (100 μg/ml) and (20 μg/ml) for ETS, MFA and HQ, respectively.
Sample Preparation
Ten tablets of sylate M® were weighed, ground and mixed well. Accurately weighed amount of the powdered tablets equivalent to 100 mg ETS and 100 mg MFA was transferred into a 100 ml volumetric flask and 50 ml methanol was added. The solution was sonicated for 15 min and completed to volume with methanol, then filtered by filter paper discarding the first few milliliters to produce tablet stock solution of (1 mg/ml) of ETS and (1 mg/ml) of MFA. Ten ml of this stock solution was transferred into a 100 ml volumetric flask and was completed to volume with methanol to obtain the tablet working solution of (100 μg/ml) of ETS and (100 μg/ml) of MFA.
Construction of the Training Set
Twelve mixtures of ETS, MFA and HQ were prepared by transferring different volumes of their working solutions into a series of 10 ml volumetric flasks and completed to volume with methanol, (Table 1). The absorbance of these mixtures were then scanned between 200 and 400 nm at 0.5 nm intervals with respect to a blank of methanol.
| Sample No. | ETS | MFA | HQ |
|---|---|---|---|
| Conc.(µg/ml) | Conc.(µg/ml) | Conc.(µg/ml) | |
| 1 | 10 | 9.6 | 3 |
| 2 | 10 | 10 | 2.92 |
| 3 | 10 | 10.4 | 2.84 |
| 4 | 20 | 19.6 | 2.52 |
| 5 | 20 | 20 | 2.44 |
| 6 | 20 | 20.4 | 2.36 |
| 7 | 30 | 29.6 | 2.04 |
| 8 | 30 | 30 | 1.96 |
| 9 | 30 | 30.4 | 1.88 |
| 10 | 40 | 39.6 | 1.56 |
| 11 | 40 | 40 | 1.48 |
| 12 | 40 | 40.4 | 1.4 |
Table 1: The concentrations of different mixtures of ETS, MFA and HQ used in the training set
Construction of the PCR and PLS Models
Two multivariate calibration models (PCR and PLS) were constructed using the obtained data. In these methods, the absorbance data matrix for the training set concentration matrix was obtained by measuring the absorbance between 225 and 235 nm at 0.5 nm intervals. Calibration or regression was then obtained by using the absorbance data matrix and the concentration data matrix for the determination of the unknown concentrations of ETS and MFA in laboratory prepared mixtures and pharmaceutical dosage form. For PCR and PLS methods, the training set absorbance and concentration matrices together with PLS-toolbox 2.0 software were used for the calculations.
Selection of the Optimum Number of Factors to Build the PCR and PLS Models
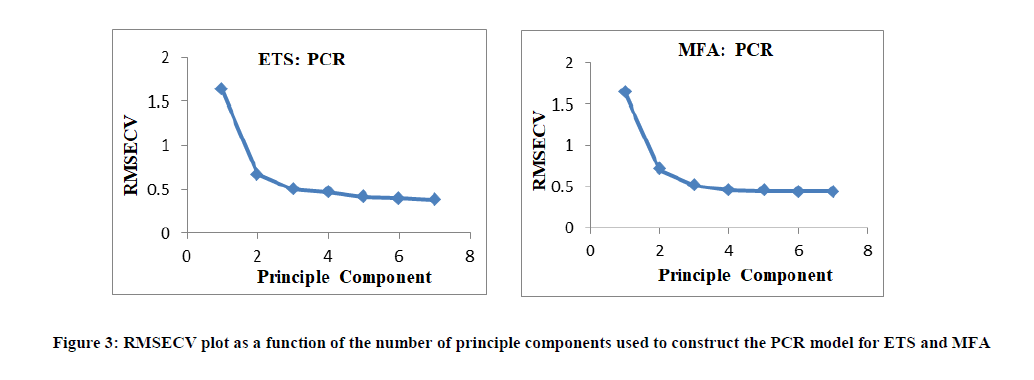
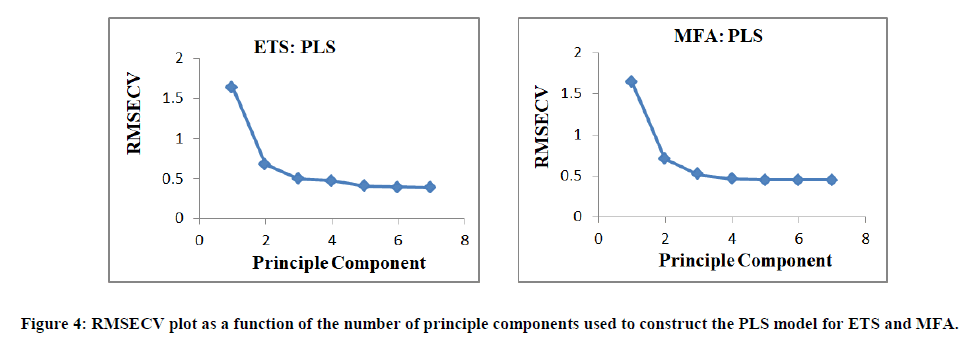
The cross validation method was used, leaving out one sample at a time, to select the optimum number of factors [37]. PLS and PCR calibration on eleven calibration spectra were performed and, using this calibration, the concentration of the sample left out during the calibration process was predicted. This process was repeated twelve times until each training sample had been left out once. The predicted concentrations of the two drugs in each sample were compared with the actual concentrations in this calibration samples and Root-Mean-Square Error of Cross-Validation (RMSECV) was calculated for each method. It indicates both the precision and accuracy of predictions. It was recalculated upon addition of each new factor to the PLS and PCR models.

Where, PRESS is the predicted residual error sum of squares and n is the number of calibration samples [38]

Where, Ypred and Ytrue are the predicted and true concentrations in μg/ml, respectively.
Construction of the Validation Set
To evaluate the prediction performance of the proposed chemometric models, nine different aliquots of the working solutions equivalent to (100-400 μg of ETS and 96-404 μg of MFA) in presence of (14-30 μg of HQ) were transferred into a series of 10 ml volumetric flasks and completed to volume with methanol and procedure under construction of the training set was repeated. The suggested models were applied to these mixtures to predict the concentrations of ETS and MFA.
Analysis of ETS and MFA in Sylate M® tablets
The two chemometric models were applied to simultaneous estimation of ETS and MFA in commercial tablets. Different aliquots of the tablet working solution equivalent to (130-330 μg) of ETS and (130-330 μg) of MFA, were transferred into a series of 10 ml volumetric flasks and completed to volume with methanol. The spectra of the prepared solutions were scanned and the procedure was followed up as mentioned previously under construction of the training set. The developed models were applied to calculate the concentrations of ETS and MFA. The experiment was repeated using standard addition technique.
Results and Discussion
PCR and PLS
The data of absorbance in the wavelength range 225-235 nm with the interval 0.5 nm were chosen as it provided the high amount of information of the two drugs in the binary mixture even in presence of some impurities while data from 200 nm to 225 nm and above 235 nm were rejected.
For PCR and PLS techniques, before constructing the models, the choice of optimum number of factors was very important stage. If the number taken was less than the required number, meaningful data that would be necessary for the calibration might be ignored. On the other hand, If the number of factors taken was more than the required number, more noise could be added to the data. Selection of the optimum number of factors was performed by visual inspection. Three factors were selected visually and found suitable for both PCR and PLS methods as shown in Figures 3, 4.
Accuracy
The accuracy was assessed by applying the proposed chemometric methods obtained for the simultaneous determination of ETS and MFA in presence of HQ in laboratory prepared mixtures (in a ratio similar to that of the pharmaceutical dosage form) and the mean percentage recoveries were calculated (Table 2). Accuracy of the method was also confirmed by recovery studies from tablet at different levels of standard additions. Good mean percentage recoveries were obtained, indicating there was no interference from the co-formulated drug or the frequently encountered tablet excipients (Table 2).
| Item | Principal Component Regression (PCR) | Partial Least Square | ||
|---|---|---|---|---|
| (PLS) | ||||
| ETS | MFA | ETS | MFA | |
| Solvent Used | Methanol | |||
| Wavelength Range | 225-235 nm | |||
| Results | ||||
| Recovery% in laboratory prepared mixture (Validation set) | 100.89 ± 1.092 | 100.91 ±1.083 | 100.87 ±1.094 | 100.91 ±1.082 |
| Recovery% in (Sylate M® tablet) dosage form | 101.42 ±0.905 | 101.43 ±0.891 | 101.43 ±0.901 | 101.47 ±0.887 |
| Recovery% of standard added | 99.74 ± 1.722 | 99.72 ± 1.649 | 99.75 ± 1.715 | 99.74 ± 1.657 |
Table 2: Recovery results obtained from the simultaneous determination of ETS and MFA in synthetic mixtures (validation set), Sylate M® tablet and standard addition using PCR and PLS technique
Precision
The intraday and interday precision was determined by calculating the values of (%RSD) using three different concentrations (12, 24 and 38 μg/ml) of ETS and (12, 24 and 38 μg/ml) of MFA in triplicates during the same day and on three consecutive days in binary mixtures and results are displayed in (Table 3).
| Item | Intra-day | Inter-day | |||||||
|---|---|---|---|---|---|---|---|---|---|
| ETS | MFA | ETS | MFA | ||||||
| PCR | PLS | PCR | PLS | PCR | PLS | PCR | PLS | ||
| 12 µg/ml | Recovery % | 98.6 | 98.66 | 98.66 | 98.72 | 97.98 | 98.03 | 98.01 | 98.36 |
| SD | 0.246 | 0.196 | 0.247 | 0.196 | 1.541 | 1.536 | 1.543 | 1.537 | |
| RSD% | 0.25 | 0.198 | 0.25 | 0.198 | 1.573 | 1.567 | 1.574 | 1.567 | |
| 24 µg/ml | Recovery % | 99.11 | 99.11 | 99.15 | 99.15 | 99.33 | 99.41 | 99.38 | 99.44 |
| SD | 0.404 | 0.404 | 0.404 | 0.404 | 0.904 | 0.905 | 0.906 | 0.907 | |
| RSD% | 0.408 | 0.408 | 0.407 | 0.407 | 0.91 | 0.91 | 0.91 | 0.911 | |
| 38 µg/ml | Recovery % | 99.71 | 100.5 | 99.7 | 100.49 | 100.78 | 100.77 | 100.78 | 100.77 |
| SD | 0.652 | 0.222 | 0.651 | 0.222 | 1.092 | 1.086 | 1.091 | 1.086 | |
| RSD% | 0.653 | 0.221 | 0.653 | 0.221 | 1.082 | 1.078 | 1.084 | 1.079 | |
*SD: Standard deviation; RSD: Relative standard deviation; ETS: Etamsylate; MFA: Mefenamic acid; PCR: Principal component regression; PLS: Partial least squares
Table 3: Intra-day and inter-day precision results of the simultaneous determination of ETS and MFA in presence of ETS degradation product (HQ) using PCR, and PLS chemometric techniques
Selectivity
The two methods selectivity was evident by the good mean percentage recoveries obtained from the laboratory prepared mixtures (validation set) and from the formulated dosage form (Sylate M® tablets) without any interference from the used excipients in tablets.
Statistical Analysis
All results obtained from the proposed methods were statistically compared with those obtained from reported reference method [21, 39].The student t-test and F ratio test were applied. The obtained values of t and F were less than the values tabulated, confirming that the difference between the developed and reported methods is insignificant in terms of accuracy and precision (Table 4).
| Statistical Parameters | ETS | MFA | ||||
|---|---|---|---|---|---|---|
| Reference Method** | PCR | PLS | Reference Method*** | PCR | PLS | |
| Recovery% | 100.35 | 100.89 | 100.87 | 99.77 | 100.91 | 100.91 |
| ± SD | 1.065 | 1.092 | 1.094 | 1.154 | 1.083 | 1.082 |
| ± SE | 0.476 | 0.489 | 0.49 | 0.516 | 0.484 | 0.484 |
| RSD% | 1.061 | 1.083 | 1.085 | 1.157 | 1.073 | 1.072 |
| n | 5 | 5 | 5 | 5 | 5 | 5 |
| Variance | 1.134 | 1.194 | 1.198 | 1.333 | 1.173 | 1.172 |
| t (2.306)* | 0.785 | 0.767 | 1.61 | 1.611 | ||
| F (6.388)* | 1.053 | 1.056 | 1.136 | 1.139 | ||
SD: Standard deviation, SE: Standard error, RSD: Relative standard deviation * Figures in parentheses are the corresponding theoretical t and F values at p=0.05; ** RP-HPLC method [21]; *** USP HPLC method [39]
Table 4: Statistical comparison between the results of the proposed methods and the reference methods for the determination of ETS and MFA in presence (HQ)
Conclusion
The proposed methods (PCR and PLS) can be used for simultaneous estimation of ETS and MFA in presence of ETS degradation product (HQ) in laboratory prepared mixtures and pharmaceutical dosage form containing them without interference with each other and without the need for previous physical separation of the two drugs. Multivariate calibration models were built from the spectral and concentration data matrices. Verification of the calibrations carried out with the aid of a synthetic set of mixtures of the two compounds, produced satisfactory results showing simplicity, sensitivity, selectivity and rapidity. Hence, the developed methods can be used for quality control of the cited drugs in ordinary laboratories.
References
- SC Sweetman. Martindale: the complete drug reference. Pharmaceutical press, 2011.
- GBS Office; UKS. British Pharmacopoeia. Stationery Office. London, 2016.
- Y El-Shabrawy; N El-Enany. IL Farmaco. 2004, 59 (10), 803-808.
- Y Ni; C Ge. J Analytical Science. 2006, 22 (6), 683.
- N El-Enany; F.Belal; M Rizk. J AOAC International. 2007, 90(3), 679-685.
- N El-Enany; F Belal; M Rizk. Analytical Chemistry Indian Journal. 2009, 8(3), 334-341.
- R Issarani; KK Vankar; DK Nayak. International J ChemTech Research. 2010, 2(1), 74-78.
- M Arshad; AB Karadi; VR Darak; SA Raju. Pharma Chemica. 2011, 3(2), 347-351
- F Belal; A El-Brashy; N El-Enany; M Tolba. J fluorescence. 2011, 21(4), 1371-1384.
- Yh CHEN; F TIAN; X FAN. Chinese Journal of Pharmaceutical Analysis. 2011, 5 (31), 973-976.
- Z Pan; DD Ma; ZH Li, DH Zhang. Fenxi Shiyanshi. 2013, 32(1), 111-113.
- P Patel; VV Kharkhanis. Asian J Research in Chemistry. 2013, 6 (2), 166-168.
- GG Mohamed; EY Frag; AA Sedeek. Insight pharmaceutical Sciences. 2015, 5(1), 1-7.
- Y Gongjun; J Litong; L Zongzhou. Chinese J Pharmaceutical Analysis. 1998, 3, 311-313.
- SF Wang; Q Xu. Bioelectrochemistry. 2007, 70(2), 296-300
- GJ Yang; XL Qu; M Shen; CY Wang; QS Qu; XY Hu. Sensors and Actuators B: Chemical. 2007, 128(1), 258-265
- ZM Liu; Y Cao; X Kang. Chinese Journal of Pharmaceutical Analysis. 2011, 6, 054.
- H Rao; J Zhang; J Li. Journal of Luminescence. 2014, 29 (7), 784-790.
- RY Naik; Z Dedania; S VijayendraSwamy. International J Pharmaceutical Research Scholars. 2005, 1-19.
- N Kaul; H Agrawal; A Kakad;S Dhaneshwar; B Patil. Analytica chimica acta. 2005, 536(1), 49-70.
- N Vamshikrishna; ASK Shetty. International J ChemTech Research. 2011, 3(2), 928-932.
- A Bhojani; PP Prabhu; E Subrahmanyam. International J Pharmaceutical and Chemical Sciences. 2013, 2(4), 616-621.
- A El-Gindy; MW Nassar; KAS Attia; HH Abu-Seada; M El-Ghandour. J liquid chromatography & related technologies. 2013, 36(14), 1915-1930.
- A El-Gindy; MW Nassar; KAS Attia; HH Abu-Seada; M El-Ghandour. J AOAC International. 2013, 96(4), 730-736
- SA Helmy; HM El Bedaiwy. Saudi Pharmaceutical Journal. 2013, 21(4), 405-410.
- J Li; H Ju. J Electrophoresis. 2006, 27(17), 3467-3474.
- H Sun; L Wei; Y Wu; N Liu. J Chromatography. 2010, 878(21), 1899-1903.
- G Garg; S Saraf. Indian J Pharmaceutical Sciences. 2007, 69(2), 279-281.
- A Goyal; I Singhvi. Indian J pharmaceutical sciences. 2008, 70(1), 108-111.
- Y Jaiswal; G Talele; S Surana. J Planar Chromatography-Modern. 2005, 18(106), 460-464.
- AA El-Zaher; MA Mahrouse; AM Al-Ghani. Current Pharmaceutical Analysis. 2019, 15(6), 624-631.
- Y Jaiswal; G Talele; S Surana. J liquid chromatography & related technologies. 2007, 30(8), 1115-1124.
- A Srinivasa Rao; A Sastry. American J Pharmtech Research. 2015, 5(5), 402-414.
- F Ibrahim; MKS El-Din; AK El-Deen; K Shimizu. J chromatographic science. 2016, 55(1), 23–29.
- E Dinç; O Üstündağ. Il Farmaco. 2003, 58(11), 1151-1161.
- Y Ni; X Gong. Analytica Chimica Acta. 1997, 354(1), 163-171.
- R Kramer. CRC Press. 1998.
- A El-Gindy. Il Farmaco. 2005, 60(9), 745-753.
- USP; USPC Convention. USP 36 NF 31: United States Pharmacopeia National Formulary. 2013.


