Reviews: 2022 Vol: 14 Issue: 6
New copper (II) complexes with ethylenediamine, bipyridine and amino acids: synthesis, characterization, optimization of geometry by theoretical DFT studies, electrochemical properties and biological activities
Ahmed Adkhis1*, Fahima Belhocine-Hocini1, Malika Makhloufi-chebli1, Tahar Amrouche2, Souhila Terrachet-Bouazziz3
1Department of science, Mouloud Mammeri University, Tizi Ouzou, Algeria
2Department of science, Faculty of Biological Sciences and Agricultural Sciences, Mouloud Mammeri University of Tizi Ouzou
3Department of Chemistry, Faculty of Sciences, University Mohamed Bouguerra, Boumerdes, Algeria
- Corresponding Author:
- Ahmed Adkhis
Department of science
Mouloud Mammeri University,
Tizi Ouzou,
Algeria
Received: 02-May-2022, Manuscript No. JOCPR-22-46701; Editor assigned: 04-May-2022, PreQC No.JOCPR-22-46701 (PQ); Reviewed: 18-May-2022, QC No. JOCPR-22-46701; Revised: 02-Jun-2022, Manuscript No.JOCPR-22-46701(R); Published:16-Jun-2022,DOI:10.37532/0975-7384.2022.14(6).031.
Abstract
Three new copper (II) complexes of the formula (Cu (Trp)2 (en))0.5H2O (1), (Cu (Trp)2 (Bpy))2NO3. 4H2O (2) and (Cu(His)2(Bpy))2NO34H2O(3) (bpy=bipyridine, en=ethylenediamine, His=Histidine, Trp=tryptophan), were synthesized and characterized by elemental analysis, molar conductance measurements and IR, UV-spectral studies Visible. Molar conductance measurements suggest the non-electrolytic nature of metal complex 1 while compounds 2 and 3 are electrolytes. The electron absorption spectral data revealed an octahedral geometry of all the complexes, which is confirmed by the theoretical calculation (DFT). The electrochemical properties of the complexes obtained were studied by cyclic voltammetry. The voltammograms of all the complexes indicate a well-defined redox process corresponding to the formation of the almost quasi-reversible Cu (II)/Cu (I) couple at a scan rate of 50 and 100 mVs-1.
The antibacterial activity of copper complexes against E. coli, Staphylococcus aureus was investigated, the antioxidant properties were determined using the scavenging of the 2, 2-diphenyl-1-picrylhydrazyl radical (DPPH). The results obtained showed a good antibacterial activity of the complexes tested. Furthermore, compounds 1 and 3 exhibited better antioxidant activity than compound 2. Our experiments were focused on the antibacterial activity of both ligands and copper complexes against a (Gram positive bacteria, namely Staphylococcus aureus, versus a Gram negative bacteria, namely Escherichia-coli). The ligands as well as the copper complexes revealed important antibacterial activities against both bacteria tested. Given these results further studies dedicated to biological activity of these compounds are encouraged using other complexes from same family of complexes and more pathogenic bacterial strains. This approach based on investigation of new copper complexes with biological activities may bring new insights for chemistry and food and pharmaceutical industries.
Keywords
Bipyridine; Amino acid Copper (II) complexes; Theoretical calculation; Spectroscopic analysis Biological activities
Introduction
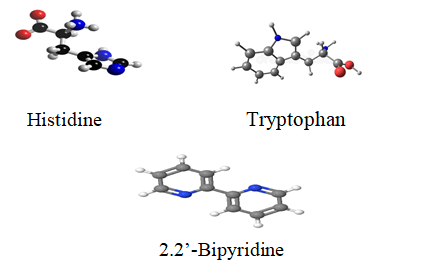
The field of nucleic acid-metal ion interactions is very broad with increasing multidisciplinary contributions, going beyond the points of view of traditional areas of science such as biology, biochemistry, genetics, medicinal chemistry and others. The diversity of research contributions has been enriched by a large variety of studies concerning the chemical and biological aspects of the interactions between metal ions and nucleic acids or their constituents [1,2]. Copper is a trace element essential for many physiological functions, including the synthesis of hemoglobin, cellular respiration, cardiac function, bone growth and as an enzymatic activator (as a component of metalloenzymes) in main pathways of metabolism [3]. Copper (II) complexes with amino acids are of significant pharmacological interest because several of them exhibit a broad spectrum of effects, in particular anti-inflammatory, antiulcer, anticonvulsant and even anti-tumor [4-8]. It has also been established that these complexes often exhibit higher pharmacological activity than that of their free ligands [4,6]. The transition metals in the first row of the periodic table are characterized by their ability to form a wide range of coordination complexes for which octahedral, tetrahedral and square plane stereochemistry predominate. The cupric ion Cu2+ is a typical transition metal ion with respect to the formation of coordination complexes [9-11], but less typical in its reluctance to adopt a regular octahedral or tetrahedral stereochemistry, the 3d9 external electronic configuration of cu2+ ion often gives distorted shapes with respect to the basic stereochemistry. In recent years, we have carried out systematic studies on the physicochemical properties of copper (II) complexes with amino acids. In this work, we explored the synthesis and characterization of novel copper (II) complexes using histidine, tryptophan, ethylenediamine and bipyridine as ligands, the structures of His, Trp and bpy are shown in the (Figure 1).
Materials and Methods
All the chemical reagents and solvents used in the synthesis of the complexes were (Fluka products) used without further purification. Infrared spectra of the solid compounds were recorded in the 4000-400 cm region. The electronic spectra were carried out using a thermo Scientific EVOLUTION 220 spectrophotometer (in absolute ethanol or in a DMSO solution); measurements were taken from 200 to 800 nm. The conductometric measurements were obtained with a consort C 3030 standards at room temperature in a 10-3 M solution of the complexes (absolute ethanol, DMSO). Electrochemical measurements were performed using a Princeton Applied Research potentiostat/galvanostat (Model 273A). The elementary micro-analysis of (C, H, and N) for the copper (II) complexes was carried out at the micro-analysis service of (ICS-CNRS Gif sur Yvette-France).The melting points of the complexes were obtained with an apparatus of the MPM-H2 type. Screening of compounds for antibacterial activity was carried out at the microbiology laboratory of Mouloud Mammeri University (UMMTO). The Functional Density Theory (TD-DFT) calculations use Becke's three-parameter hybrid method and the Lee-Yang-Parr correlation function (B3LYP) combined with the use of ORCA V4 software, which is has been shown to be very effective for many organic and inorganic products.
Synthesis of Copper (II) complexes
Synthesis of (Cu (Trp) 2(en)) 0.5 H2O (1): To 20 ml of hot absolute ethanol are added the solid salt Cu (NO3) 2.3H2O (1 mmol 0.24 g) and (2 mmol, 0.41 g) of tryptophan. To the mixture obtained, 1 mmol of ethylenediamine is added. A 1 mol.L-1 NaOH solution is gradually added to the preceding solution until pH=7. The reaction mixture obtained is kept under constant stirring and heated under reflux for 3 hours at a temperature in the region of 60°C. A light purple solid is obtained, it then filtered, washed with ethanol and dried in air.
Complex 1: Yield: 55%; Anal. Calc. for (CuC24H30N6O4)0.5H2O: Cu, 11.96%; C, 54.22%; N, 13.00% H, 4.47%. Found: Cu, 12.00 C, 55.36%; N, 12.00% H, 5.46%.
Synthesis of (Cu(Trp)2(Bpy))2NO3.4H2O (2) and (Cu(His)2(Bpy))2NO3.4H2O (3): The two copper (II) complexes are synthesized by mixing a solution of bipyridine (1 mmol, 0.156 g) dissolved in hot absolute ethanol (5 mL) with 1 mmol (0.24 g) of copper (II) nitrate salt trihydrate dissolved in 10 mL of absolute ethanol. The pH is adjusted to 7, then 1 mmol of tryptophan (0.20 g) (for complex 2) or 1 mmol of histidine (0.153 g) (for complex 3) dissolved in 5 ml of absolute ethanol are added. The reaction mixture is stirred and heated under reflux for 4 to 5 hours at a temperature of 100 °. Two blue-colored precipitates are formed at the end of the reaction; the latter are filtered off, washed with ethanol and dried in air.
Complex 2: Yield: 82%; Anal. Calc. for CuC32H40N8O14: Cu, 10.88%; C, 43.15%; N, 14.38%; H, 4.10%. Found: Cu, 11.00%; C, 43.58%; N, 14.11%; H, 3.46%.
Complex 3: Yield: 30%; Anal. Calc. for: CuC32H40N8O14 Cu, 8.76%; C, 36.37%; N, 19.29% H, 4.68%. Found: Cu, 9.00 C, 36.34%; N; 18.40%; H, 3.77%.
Antioxidant activity: The antioxidant activity (free radical scavenging activity) of the synthesized complexes was evaluated by using the 2, 2-diphenyl-1-picrylhydrazyl free radical scavenging test DPPH [12-14]. DPPH Solution was prepared by dissolving DPPH. In ethanol to give a concentration of 4 mg/100 ml. The complexes were dissolved in DMSO to obtain solutions of 10-2 M. The solutions of test compounds were diluted with DMSO to get final concentrations of 0.005, 0.0025 and 0.00125 ml/L. Subsequently, 40 µL of each tested concentration of each complex was added to each well separately in duplicate and then DPPH. Solution (2 mL) was added. Negative control wells were loaded with 40 µL of DMSO solution and 2 mL of DPPH solution. After homogenization, the mixtures were incubated at room temperature for 1 hour in darkness at 25°C, and then the absorbance of these compounds at different concentrations was recorded at 517 nm. Ascorbic Acid (AA) was used as standard for the antioxidant activity screening. A blank containing only ethanol with DMSO was used as the control. The reduction of the DPPH radical was measured by monitoring continuously the decrease of absorption at 517 nm. DPPH scavenging effect was calculated as percentage of DPPH discoloration [15, 16].
RSA (%)=((Ac-As)/Ac)x100(1) where Ac is the absorbance of the control (absorbance of DPPH ethanol solution without sample), and “As” is the absorbance of the tested compound after 60 min of incubation. The minimum inhibitory IC50 concentrations of the compounds tested are determined from the RSA (%) according to concentration graph.
Antibacterial activity: The antibacterial activity of the copper (II) complexes is tested against two pathogenic bacterial species Escherichia coli ATCC 25923, and Staphylococcus aureus ATCC 43300. All the complexes are dissolved in DMSO at concentrations ranging from 0.75 to 15 mg/mL and the antibacterial activity is studied on Mueller Hinton agar using the well diffusion method according to the method described by Mishra [17].
15 ml of sterilized Mueller-Hinton agar melted in a thermostatic bath and cooled to 45-50°C are mixed in sterile tubes with 1 ml of prepared bacterial suspension containing 10-6 CFU/ml. Then the mixture is transferred to sterile Petri dishes. The wells obtained aseptically (with a diameter of approximately 6 mm) in seeded medium are carefully filled individually with 50 μl of diluted compound. The Petri dishes are then incubated at 37°C for 24 hours.
The activity of the compound is thus determined by measuring the diameter of the zone of inhibition (mm) and compared to the standard antibiotic. The sensitivity of bacteria to the different complexes is classified according to the diameter of the inhibition halo as follows: not sensitive for diameters less than 8 mm [18], sensitive for diameters 9-14 mm, very sensitive for diameters between 15 and 19 mm and extremely sensitive for diameters greater than 20 mm [19]. DMSO (which has no activity) and the standard antibiotic (klamoxilyne) are used as negative and positive controls, respectively, for the tests for antibacterial activity. All experiments are performed four times and the average inhibition zone is calculated. The Minimum Bacterial Concentration (CMB) values are determined from the results of subcultures of the strains extracted from dishes exhibiting a zone of inhibition after evaluation of the Minimum Inhibitory Concentration (MIC). To determine the interaction between copper (II) complexes and the combined effects of these complexes and lactic acid on the growth of E. coli, further tests for antibacterial activity are performed using the well diffusion method previously described above.
Theoretical studies: In this work, the molecular structure optimization of synthesized complexes and corresponding vibrational harmonic frequencies were computed by using standard Becke’s three parameter hybrid model, Lee-Yang-Parr (B3LYP) functional (B3LYP) [20,21]. Density Functional Exchange Theory (DFT) and 6-31G** and LANL2DZ basis sets were used as implemented in ORCA v4 [22, 23] software. It is worth noting that, B3LYP functional has been successfully used in some previous works for geometry optimization of transition metal complexes. It proved to be sufficient to produce acceptable geometric and spectroscopic parameters comparable to experimental ones. The stability of the optimized geometries was confirmed by wavenumber calculations, which gave positive values for all obtained wavenumbers. After this, theoretical spectra were obtained using the Time-Dependent Density Functional Theory (TD-DFT) calculations with B3LYP method at the same level of theory [24-27]. It is worth noting that previous studies were demonstrated the capability of chosen method and basis set to predict the electronic properties of metallic complexes quite reasonably [28-32].
Results and Discussion
The complexes were obtained in the form of powders and attempts to obtain single crystals were unsuccessful. The physical properties of the synthesized compounds and their analytical data are summarized in Table 1; their empirical formulas are obtained on the basis of elemental analysis. The complexes are soluble in ethanol and DMSO.
The results of elementary analyze and spectroscopic methods (UV-Visible and IR) made it possible to propose the following formulas: Cu(Trp)2(en)0.5H2O (complex 1), Cu(Trp)2(bpy)2NO3.4H2O (complex 2) and Cu(His)2(bpy) 2NO34H2O (complex 3). The melting point of all complexes exceeds 200°C, this proves that all complexes are stable in air and can be stored at room temperature. The molar conductance values of all the complexes obtained from 10-3 M DMSO solutions indicate the non-electrolytic nature of Complex 1 while Complexes 2 and 3 are rather electrolytes.
UV-visible spectroscopic study on the effect of metal stoichiometry on ligands
In order to optimize the complexion, a study is carried out to determine the molar ratio M/L necessary for the synthesis of the complexes. The solution of the ligands and that of the metal caution are prepared in absolute ethanol at concentrations of 10-5 mol.L-1 for the ligands and 0.25.10-5, 0.5.10-5, 0.75.10-5, 1.10-5, 1.5 10-5 and 2.10-5 mol.L-1 for salt (Cu (NO3) 2)3H2O.
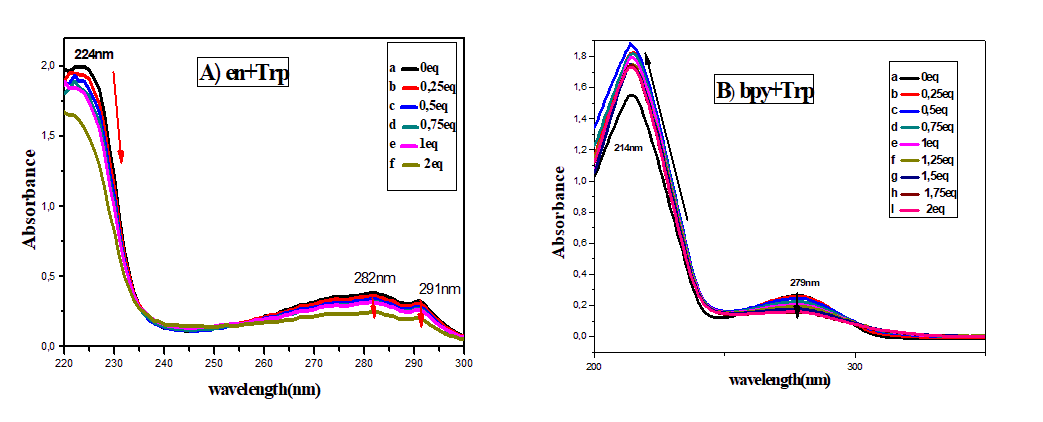
The absorption spectra of the free ligands ethylenediamine, bipyridine and tryptophan and of the mixture (Trp-en) (2:1) and (Trp-bpy) (1:1) were studied. The absorption spectrum of the mixture (en-Trp) has three bands, one of which is intense at 224 nm. These bands can be assigned to π-π* transitions.
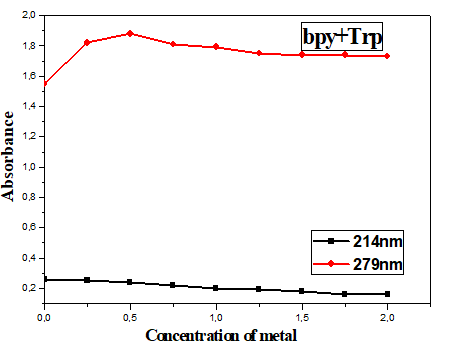
On the other hand, the spectrum of the Trp-bpy mixture indicates two bands, a high wavelength band located at 214 nm and a low intensity band around 280 nm. These bands are associated with π-π* transitions. Adding (Cu (NO3)2)3H2O to solutions of (Trp-en) (2:1) (10-5 mol.L-1) and (Trp-bpy) (1:1) (10-5 mol.L-1) in ethanol absolute induces drastic changes in absorption spectra. For the mixture (Trp-en), a strong hypochromic effect is observed on the wavelength bands at 224 nm, 282 nm and 291 nm (Figure 2A, curves a to f). On the contrary, the spectrum of the mixture (Trp-bpy) shows a hyperchromic effect in the wavelength bands at 214 nm and at 279 nm (Figure 2B, curves a of i).
Figure 2: A) Absorption spectrum of ligands (10-5 mol.L-1) in absolute ethanol in the absence (curve a) and presence of (Cu (NO3)2)3H2O curve (b to f) for the ligands (en+Trp) at the concentration: 0.125.10-5, 0.25.10-5, 0.5.10-5, 10-5 and 2.10-5 mol.L-1. B) Absorption spectrum of ligands (10-5 mol.L-1) in Absolute ethanol in the absence (curve a) and presence of Cu (NO3)2.3H2O. Curve (b to I) for ligands (Bpy+Trp) at the concentration: 0.125.10-5, 0.25.10-5, 0.5.10-5, 10-5 and 2.10-5 mol.L-1.
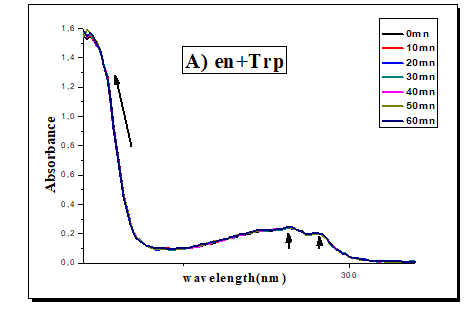
The time factor on the metal-ligand coordination (1:2) for the mixture (Trp-en) and (1:1) for the mixture (Trp-bpy) is also studied. A hyperchromic effect is observed on the bands of wavelengths equal to 214 and 279 nm for the mixture (Trp-bpy) and no change is observed for the mixture (Trp-en) (Figure 3).
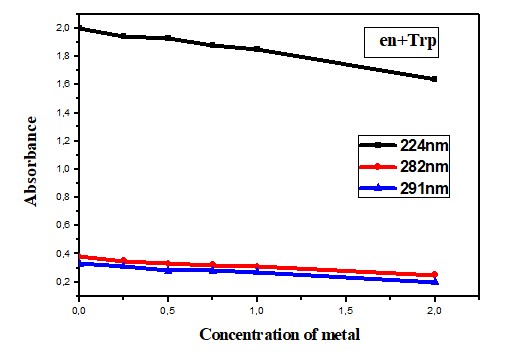
Absorbance is analyzed as a function of cation concentration (Figures 4 and 5). As the shape of the absorption spectrum varies greatly in the presence of cations, the absorbance is recorded at three different wavelengths for the spectrum (en-Trp) and at two wavelengths for the spectrum (bpy-Trp) chosen in order to obtain as much information as possible. The calculation is carried out simultaneously on the two and three bands obtained by absorption spectroscopy. Good adjustments are obtained as shown in Figures 4 and 5. The results show that from an equimolar metal/ligand ratio, the absorbance becomes constant.
Effect of pH on the absorption wavelength of the ligand
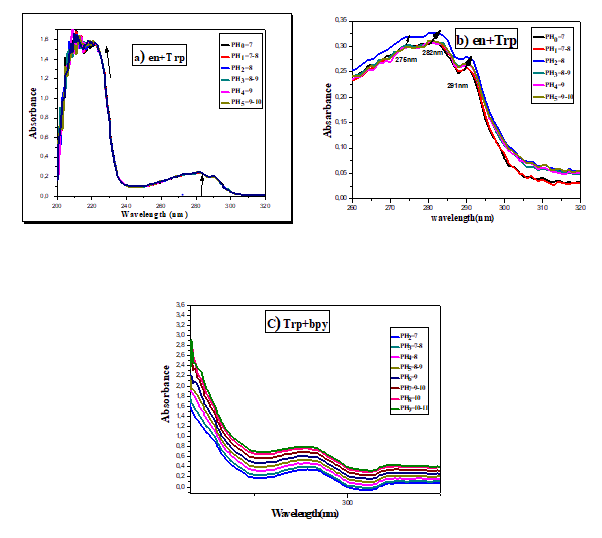
A UV-Vis spectrophotometric study of the effect of pH on wavelength shift of ligands was performed to optimize the pH value affecting the wavelength of ligand uptake. The pH change was carried out by addition of NaOH (0.1 mol.L-1) to a solution of ligands dissolved in absolute ethanol prepared at a concentration of 10-5 M. Figure 6 show the influence of pH on UV-Vis spectra of absorption of ligands (Table 1).
Table 1: Analytical data of the complexes.
| Compounds | Color | Yield (%) | MP (°C) | Anal-Found/calculated (%) | MC (Ω-1cm2mol-1) | |||
|---|---|---|---|---|---|---|---|---|
| C | H | N | Cu | |||||
| Cu(Trp)2(en)0.5H2O | Violet | 55 | 258 | 55.36 | 5.46 | 12 | 12 | 29.3 |
| 54.22 | 4.47 | 13 | 11.96 | |||||
| Cu(Trp)2(bpy)2NO3.4HO | Blue oil | 82 | 270 | 43.58 | 3.46 | 14.11 | 11 | 636 |
| 43.15 | 4.1 | 14.38 | 10.88 | |||||
| Cu(His)2(bpy)2NO34H2O | Blue | 30 | 267 | 36.34 | 3.77 | 18.4 | 9 | 482 |
| 36.37 | 4.68 | 19.29 | 8.76 | |||||
Initially, the pH value recorded for a 10-5 mol.L-1 ligand solution is of the order of 6-7 (without base addition). However, the addition of 10% NaOH drops causes a change in pH. Hyperchromic displacement of the absorption wavelength at (224 nm, 282 nm, 291 nm) and appearance of a new absorption wavelength at 275 nm by ligands (en-Trp) (Figures 6a and 6b). Hyperchromic effect of short wavelength bands at 279 nm and 214 nm by ligands (bpy-Trp) (Figure 6c). Following these results, it is preferable to work at a pH of less than 8 during the synthesis of the complex.
Characterization of the ligands and the complexes
Electronic spectra: Electronic spectra of ligands and copper (II) complexes were recorded in DMSO solution. The results grouping together the values of the wavelengths in the UV and the visible are given in Table 2.
The electron absorption spectra of the free ligands, bipyridine and tryptophan each show two bands, one of which of medium intensity is located around 215 nm and another of high intensity is localized around 280 nm. These bands are assigned to the π-π* transitions. In addition, the histidine spectrum shows a single band of high intensity at 219 nm, the latter can also be associated with a π-π* transition [33].
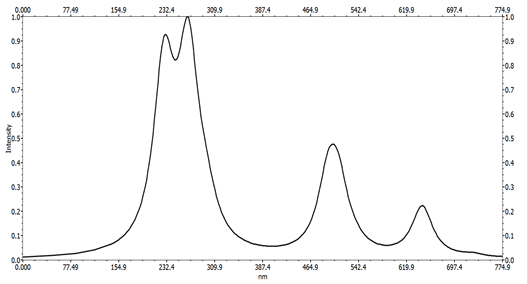
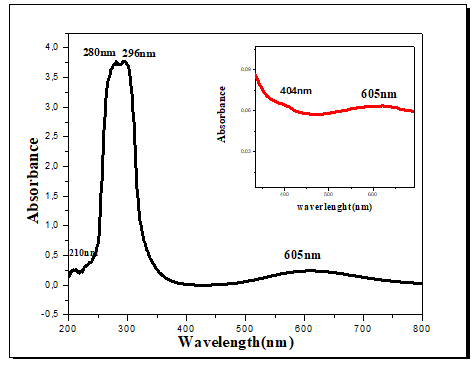
The electronic spectra of all the complexes show two bands in the region 204-296 nm, these bands could be attributed to the π-π* transitions. While the bands at 301 and 303 nm for complexes 2 and 3, respectively, could be associated with the n-π* transitions. The spectrum of complex 1 show a band at 404 nm, the latter may be due to a Ligand-Metal Charge Transfer Band (LMCT). The electronic spectra of complexes 1, 2 and 3 show a new and broad asymmetric band in the visible domain, respectively at 605, 599 and 668 nm, this band is attributed to the d-d transition (2Eg-2T2g), characteristic octahedral geometry of a configuration d9 [34-36]. The UV-visible spectrum of complex 1 is illustrated by way of example in Figure 7.
Table 2: Electronic absorption bands of Cu(II) complexes.
| Complexes | l(nm) | n(cm-1) | Electronic transition |
|---|---|---|---|
| Bpy | 213 | 46948 | π-π* |
| 280 | 35714 | π-π* | |
| Trp | 216 | 46296 | π-π* |
| 279 | 35842 | π-π* | |
| His | 219 | 45662 | π-π* |
| Cu(Trp)2(en)0.5H2O | 210 | 47619 | π-π* |
| 296 | 33784 | π-π* | |
| 404 | 24752 | CT | |
| 605 | 16529 | d-d transition | |
| (Cu(Trp)2(bpy))2NO3.4HO | 208 | 48077 | π-π* |
| 248 | 40323 | π-π* | |
| 301 | 33222 | n-π* | |
| 599 | 16694 | d-d transition | |
| (Cu(His)2(bpy))2NO34H2O | 204 | 49019 | π-π* |
| 244 | 40984 | π-π* | |
| 303 | 33003 | n-π* | |
| 668 | 14970 | d-d transition |
Infrared spectra: The infrared spectra of the synthesized mixed ligand complexes were recorded in the region of 4000 to 400 cm-1. Analysis of infrared spectra is a suitable technique for determining the presence of ligands in coordinating compounds. The IR study therefore consists in comparing the spectra of the free ligands with those of their complexes. The values of the main IR absorption bands of the spectra of ligands and metal complexes 1-3 are summarized in Table 3.
Table 3: The main vibrations of the ligands and the complexes (cm-1).
| Ligands and complexes | νas(NH2)νs(NH2) | ν(N-H)Cm-1 | ν(C=N) Cm-1 | ν(C-H)Cm-1 | νas(COO-) Cm-1 | νs(COO-)Cm-1 | δ(NH2) Cm-1 | ν(Cu-O)Cm-1 | ν(Cu-N)Cm-1 |
|---|---|---|---|---|---|---|---|---|---|
| en | 3368 | - | - | - | - | - | 1597 | - | - |
| 3284 | |||||||||
| bpy | - | 3064 | 1578 | 2927 | - | - | - | - | - |
| Trp | - | 3350 | - | - | 1665 | 1416 | 1590 | - | - |
| His | - | 3250 | - | 2862 | 1628 | 1412 | 1583 | - | - |
| Cu(Trp)2(en)0.5H2O | 3342 | 3386 | - | 2907 | 1620 | 1430 | 1570 | 496 | 426 |
| 3273 | - | ||||||||
| Cu(Trp)2(bpy)2NO3.4H2O | 3232 | 3393 | - | 2913 | 1611 | 1442 | - | 558 | 419 |
| 3143 | |||||||||
| Cu(His)2(bpy)2NO34H2O | 3237 | 3388 | 1604 | 2911 | 1643 | 1391 | 1604 | 473 | 419 |
| 3145 |
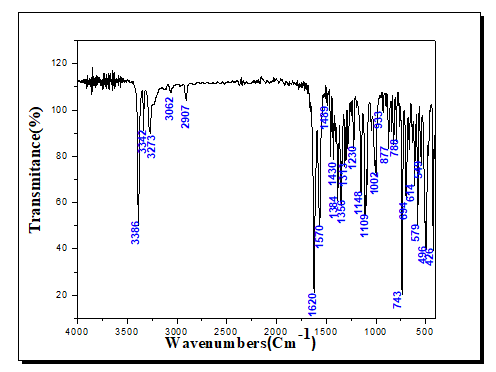
The IR spectrum of bipyridine shows a band at 1578 cm-1, this band is due to the vibration frequency (C=N) [37], this band is not observed in the spectrum of complex 2, it is probably masked by those corresponding to (COO-) or δ(NH2). The relatively low energy of the band (C=N) could be attributed to the involvement of the group (C=N) in conjugation in the aromatic system. The infrared spectra of the bpy ligand indicate a low intensity band around 2927 cm-1, this band is attributed to the stretching vibration of CH which shifted slightly to the low frequencies in the complexes (2911, 2913 cm-1). The spectrum of ethylenediamine shows two bands of medium intensity at 3368 (vas) and 3284 cm-1 (vs). These bands are shifted to low wavenumber values, 3342 and 3273 cm-1, respectively in the spectrum of complex 1, indicating the coordination of the NH2 function with the metal. The band observed at 1597 cm-1 in the spectrum of ethylenediamine is attributed to (NH2), this band is shifted to 1570 cm-1 in the spectra of the complex [38].
The IR spectra of the ligands show a band between 3064 and 3350 cm-1 which corresponds to the NH stretching vibrations. In the spectrum of compounds, this band is observed in the range 3386-3393 cm-1. The IR spectra of the amino acids Trp and His show two characteristic bands at 1665 and 1628 cm-1, respectively, these latter are associated with those of asymmetric vibrations (νas). These frequencies are shifted to lower wave numbers (1643-1611 cm-1) in the complexes spectrum, indicating the coordination of the COO group via the oxygen atom with the metal. While the bands observed at 1416 and 1412 cm-1 are assigned to symmetrical vibration frequencies νs (COO-). The nature of the metal-ligand bond is confirmed by the presence of new bands in the 419-558 cm-1 region. These bands are attributed to Cu-N and Cu-O vibrations, respectively. A strong and distinct band observed in the ligand spectrum between 1578 and 1583 cm-1 can be associated with the vibrations of the aromatic ring [39,40].
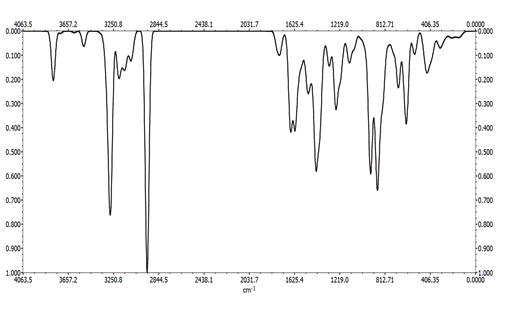
The frequency is lowered on chelation and apparently is independent of the nature of the metal. The representative IR spectra of (Cu (Trp) 2(en)) 0.5H2O complex is shown in Figure 8 and the three other spectra are given in the supplementary material section.
Complex structures and theoretical studies
In order to compare the experimental UV-visible absorption spectrum of the Cu (Trp) 2(en)0.5H2O complex to that obtained from the theoretical calculations obtained by the TD-DFT/B3LYP theory, using 6-31G** and LANL2DZ [40]. The basic sets are given in Figure 9.
The results suggest that the calculated UV-visible absorption spectrum agrees with the experimental spectrum. However, the electron absorption spectrum of the complex shows, in the ultraviolet range, two broad bands with a shoulder located at 233.00 nm (42918cm-1), 296.14 nm (33715.44 cm-1) and 314, 00 nm (31836.99 cm-1). These bands, corresponding to the energy part of the UV-visible spectra according to the results reported in Table 4, are due to an intra-ligand π-π* transition of the> C=O function of the Trp ligand. Two bands appear in the visible range at 501.30 nm (19948.13 cm-1) and 644.00 nm (15527.95 cm-1), These bands are due to the d-d transition [41].
Table 4: Electronic absorption bands of complex Cu(Trp)2(en)0.5H2O.
| Excited states | Experimental | Calculated TD-DFT spectrum | ||
|---|---|---|---|---|
| λ (nm) | λ (nm) | E (eV) | Transition | |
| 1 | 605 | 644 | 1.92 | d-d |
| 2 | 404 | 501.3 | 2.47 | CT |
| 3 | 296 | 314.1 | 3.94 | π àπ* |
| 4 | 280 | 296.6 | 4.18 | πàπ* |
| 5 | 210 | 233 | 5.32 | πàπ* |
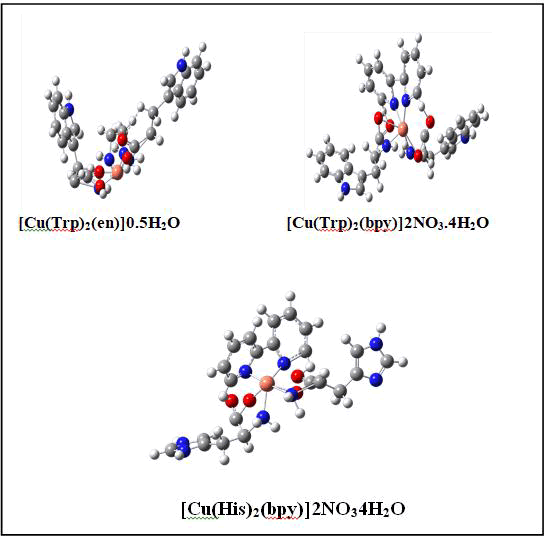
The theoretical and experimental FT-IR spectra of (Cu (Trp)2(en))0.5H2O are given in Figure 9. The comparisons of these two spectra show that the theoretical calculations are in good agreement with experimental one. The stretching vibration band of C=O bond of the Tryptophan ligand was shifted to 1620 cm-1. The IR spectra of synthesized complex revealed two peaks at 426 and 496 due to Cu-N and Cu-O bond, respectively [42]. The IR spectra indicate that the ligands are coordinated with the metal. The coordination occurs through the N-atoms from the ethylenediamine and O-atoms from the Tryptophan. On basis of the electronic spectra and theoretical studies, the complexes were formulated as of Cu(Trp)2(en)0.5H2O, Cu(Trp)2(bpy)2NO34H2O and Cu(His)2(bpy)2NO34H2O (Figure 10) (Table 5).
Table 5: Cyclic voltammetric data of the complexes
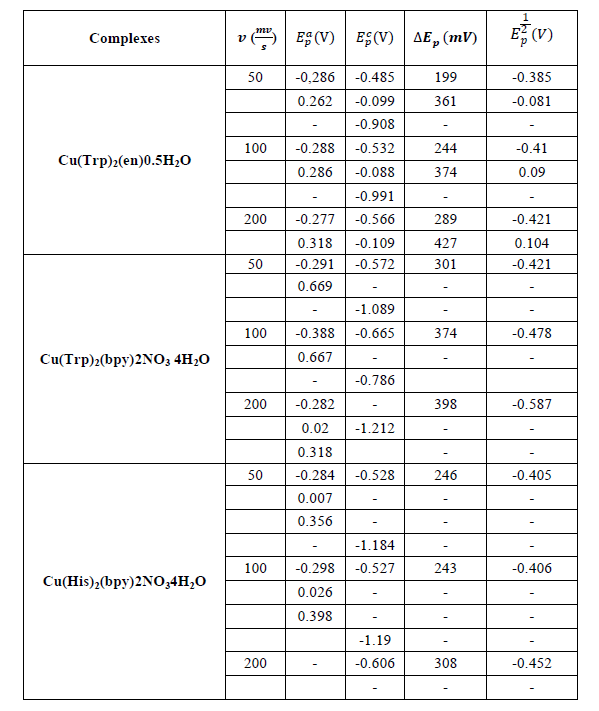
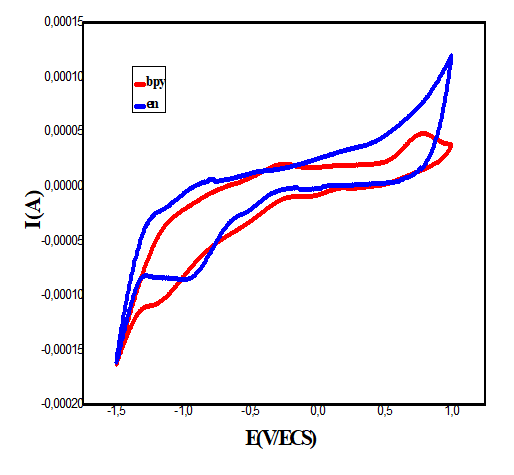
Cyclic voltammetry study: The electrochemical behavior of copper complexes was studied with an EG and G Princeton Applied Research potentiostat/galvanostat (model 273A) controlled with Power-suite software using a standard three electrodes system in an undivided cell. A helical platinum wire and a Saturated Calomel Electrode (SCE) were employed as counter and reference electrode respectively and a Glassy Carbon Electrode (GCE) 2 mm in diameter is used as working electrode. The scanning rate is between 50 and 200 mV.s-1; the concentration of the copper (II) complexes used is 10-3 mol.L-1 with 0.1 mol.L-1 KCl as supporting electrolyte. All measurements were carried out at room temperature. The voltammograms giving rise to the data reported in Table 4 are obtained in the potential range (-1.5)-(+1.0 V/SCE). The compounds studied each show two or three reduction waves unlike the ligands. This suggests the presence of the metal ion in their structures [43].
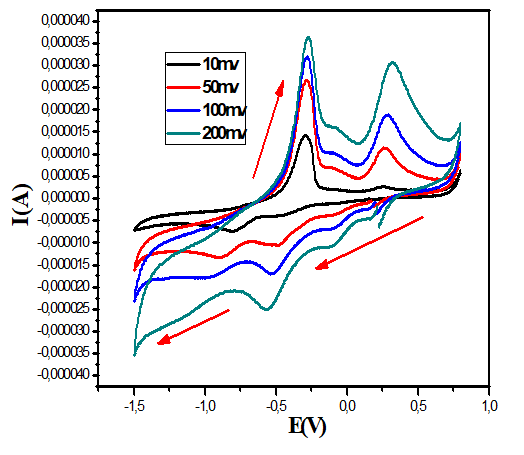
The cyclic voltammograms of complex 1 (Figure 11) show well defined redox process corresponding to the formation of the quasi reversible Cu (II)/Cu (I) system. The anodic peaks corresponding to the oxidation observed at 50, 100 and 200 mV.s-1 is respectively -0.286, -0.288 and 0.277 V. The associated cathodic peak are -0.485, -0.532 and -0.566 V, respectively. The cyclic voltammogram of the complex Cu(Trp)2(en)0.5H2O recorded at 100 mV/s, shows another cathodic peak at -0.991 V which can be attributed to the ligand en.
The voltammograms of the complexes 2 and 3 recorded at 50 and 100 mV/s, show cathodic and anodic peaks at -0.572, -0.271V and -0.528, -0.282V respectively which are attributed the quasi-reversible process Cu(II)/Cu(I) system. These compounds show also an irreversible process characterized by a cathodic peak at -1.089 and -1.190 V, respectively for the compounds 2 and 3, which probably correspond to the irreversible reduction of the copper(I) to the Copper(0) species.
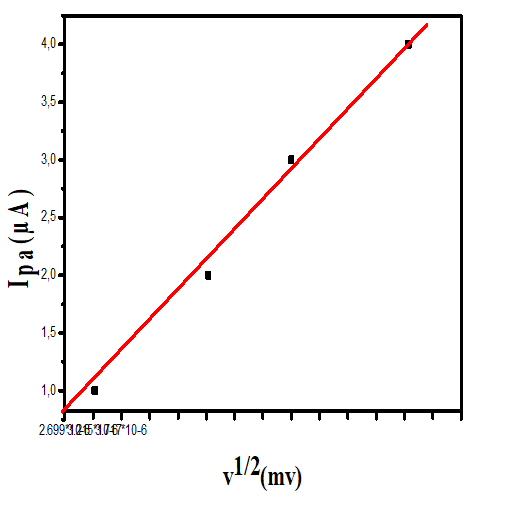
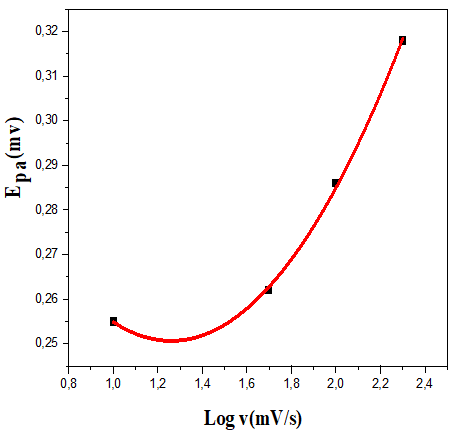
On the other hand, for the latter complexes, the almost quasi-reversible process characterized by a cathodic and anodic wave is observed only at scan rates of 50 and 100 mV.s-1. While, an irreversible process is observed for both compounds at 200 mV.s-1.The results of the voltammetry study summarized in Table 5, suggest that the electron transfer processes considered are a quasi-reversible nature at a scan rate of 50 and 100 mV.s-1 for all the complexes. This is evidenced, on the one hand, by the values of ΔEp, Ep1/2 and the peak ratios (I_p^a)/(I_p^c )≠1 on the other hand [44]. Moreover the variation of the current of the anodic peak (I_p^a) as a function of the square root of the scan rate (v^ (1/2) (Figures 12-15) is a straight line through the origin which reveals that electrochemical processes are mainly under diffusion control.
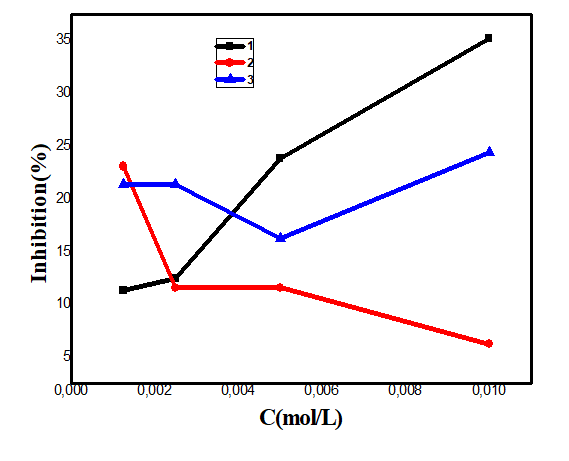
Antioxidant activity: The antioxidant activity of the complexes was measured in terms of their hydrogen donating or radical scavenging ability by UV-V is spectrophotometer using the stable 2,2-diphenyl-1-picrylhydrazyl radical (DPPH). DPPH are stable free radicals and in the presence of molecules capable of donating H atoms, its radical character is neutralized. This is visually noticeable as the colour changes from purple to yellow. When complexes as antioxidant donate protons to this radical, the initial absorbance of DPPH solution decreases. When complexes as antioxidant donate protons to this radical, the initial absorbance of DPPH solution decreases [45]. Figure 16 shows the variation of absorbance versus concentration of the different complexes and of the standard (ascorbic acid). Lowering the absorbance of the reaction mixture indicates higher free radical scavenging activity. Figure 16 shows that the antioxidant activity of complexes 1 and 3 is moderate and their inhibition percentages are about 35%, 24%. Complex 2 antioxidants at a concentration of 0.000125 mol. L-1 and from these concentration become oxidant.
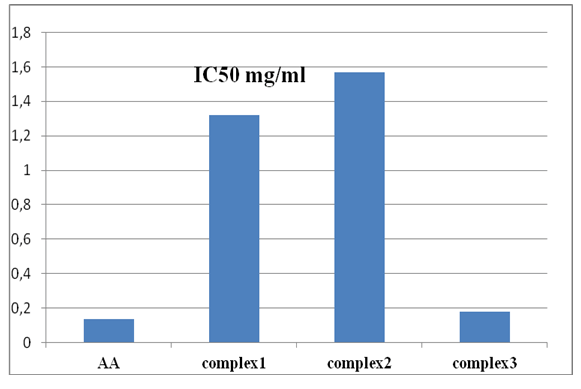
Minimum inhibitory concentrations IC50 of the tested compounds are illustrated in Figure 17 and 18. The lower IC50 value (minimal inhibitory concentration) indicates a stronger ability of the tested compound to act as DPPH scavenger while the higher IC50 value reveals a lower scavenging activity of the scavengers.
Research works have been carried out to study the antioxidant properties of copper complexes [46]. However, there is little known works on copper complexes with amino acids with ethylenediamine and bipyridine. Table 6 summarize the values of minimum inhibitory concentrations IC50 of the tested compounds.
Table 6: IC50 values of the metal complexes
| Materials | IC50 (mg/ml) |
|---|---|
| AA | 0.134 |
| (Cu(Trp)2en)0.5H2O | 1.319 |
| Cu(Trp)2(bpy)2NO3 4H2O | 1.569 |
| Cu(Trp)2(His)2NO3 4H2O | 0.177 |
The complexes 1, 2 and 3 showed inhibitory concentration of 50% free radical IC50 of 1.319, 1.569 and 0.177 mg/ml respectively while ascorbic acid (AA positive control) presented a value of 0.134 mg/ml.
Table7: Values of zone inhibition (mm) produced by copper complexes against E.coli and S.aureus
| Compound | Zone of inhibition (mm) produced by copper complexes Against E.Coli at a concentration of : | Zone of inhibition (mm) produced by copper complexes Against S. aureus at a concentration of : | ||||||||
|---|---|---|---|---|---|---|---|---|---|---|
| 3 mg/ml | 6 mg/ml | 9 mg/ml | 12 mg/ml | 15 mg/ml | 3 mg/ml | 6 mg/ml | 9 mg/ml | 12 mg/ml | 15 mg/ml | |
| Trp | - | - | - | - | 9 | - | - | - | - | - |
| His | - | - | - | - | 8 | - | - | - | - | - |
| En | - | - | - | - | 8 | - | - | - | - | - |
| Bpy | - | - | - | - | 25 | - | - | - | - | - |
| ANT | - | - | - | - | 50 | - | - | - | - | 45 |
| Salt copper | - | - | - | - | 14 | - | - | - | - | - |
| Cu(Trp)2(en)0.5H2O | 12 | 13 | 14 | 15 | 16 | 8 | 8 | 12 | 14 | 16 |
| Cu(Trp)2(Bpy)2NO34 H2O | 13 | 14 | 15 | 23 | 24 | 11 | 12 | 16 | 18 | 19 |
| Cu(His)2(Bpy)2NO34H2O | 15 | 16 | 18 | 24 | 25 | 16 | 17 | 18 | 19 | 20 |
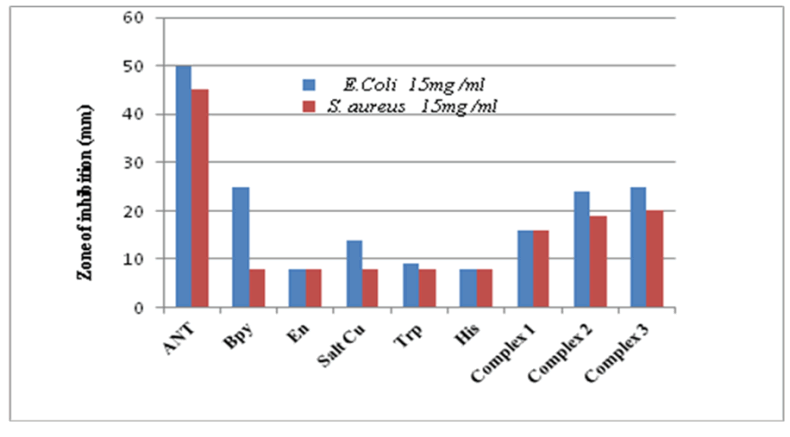
Antibacterial activity: Antibacterial activity assessed on copper (II) complexes dissolved in DMSO at concentrations of 0.75 to 15 mg/ml tested against Gram-negative bacteria (E.coli) and Gram positive bacteria (S.aureus) demonstrated growth inhibition at different levels. Based on results shown in Table 7 antimicrobial effect observed was dose and species-dependant. Our results indicated that all copper complexes tested were found to have a higher inhibition efficiency than free ligands [47], demonstrating that the complexation of the metal increases the activity of the ligand. This may suggest that complexation facilitates the ability of the complex to cross a cell membrane and could be explained on the basis of chelation theory According to scientific literature; coordination greatly reduces the polarity of the metal ion due to the positive charge of the metal which is partially shared between donors atoms present in the ligands. In addition, chelation has the effect of promoting the delocalization of π electrons over the entire chelated cycle and reinforces the lipophilic character of complexes. Increased lipophilicity improves the transport of complexes. Gram-negative bacterium E. coli showed higher inhibition zones than those observed with Gram-positive bacterium S. aureus (Figure 18). E. coli was revealed more sensitivet than S. aureus showing some resistance due to its structure.
Determination of MIC (Minimal Inhibitory Concentrations) and MBC (Minimal Bactericidal Concentrations) values for antibacterial agents tested on E. coli and S.aureus: MIC and MBC values of antibacterial activity of Copper (II) complexes are shown in Table 8. Interestingly, high activity was observed against bacteria E. coli and S. aureus for all copper (II) complexes, displaying low values of MIC around 3 mg/ml. However, copper complex 1 demonstrated weak antibacterial activity against S. aureus. According to our results all the complexes exert a bactericidal effect on all the strains tested.
Table 8: MIC and MBC values (mg/ml) of copper (II) complexes tested against E. coli and S. aureus
| Compound | CMI (mg/ml) | MBC (mg/ml) | ||
|---|---|---|---|---|
| E. Coli S.aureus | E. Coli S.aureus | |||
| Cu(Trp)2(en)0.5H2O | 3 | 9 | 9 | 12 |
| Cu(Trp)2(Bpy)2No34H2O | 3 | 3 | 12 | 12 |
| Cu(His)2(Bpy)2No34H2O | 3 | 3 | 12 | 12 |
Combination of antimicrobial agents
According to PIBIRI (2005) [48], the effects of combinations of antibacterial agents are defined according to four possible Interactions: indifference, addition, synergy and antagonism. These tests consist of volume-to-volume mixing of two antibacterial substances with dilutions given by the well diffusion method, with reference to MIC in order to obtain sub-inhibitory minimum concentrations. Each antimicrobial agent has been diluted in different concentrations and different combinations of antibacterial agents were performed by association of two complexes or two complexes added with lactic acid. Wells were filled with 50 μl of mixture of antibacterial agents. After incubation, diameters of inhibition zones were measured and compared with those of antimicrobial agents tested alone.
Combination between two complexes
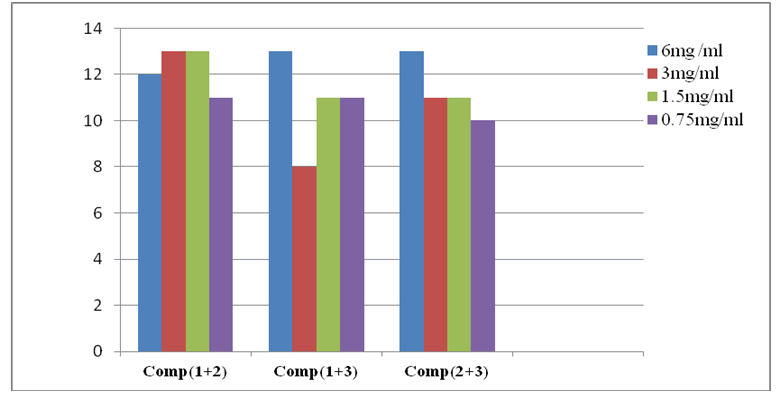
We examined the antibacterial activity of combinations of two complexes using well diffusion method at concentrations ranging from 6 to 0.75 mg/ml to determine the nature of their interaction on bacterial growth. Results obtained are shown in Figure 19. Our findings demonstrated that combination of two complexes enhanced inhibitory effect against E. coli at all concentrations leading to low subinhibitory concentrations about 1.5 and 0.75 mg/ml, considering that these values are below MIC values. The interactions observed were probably synergistic due to strong chemical interactions between the major components of copper complexes. The mode of action of combinations was probably different from that observed with same agents tested individually. Assumed that one of combined agents has weakened the microorganism and the other killed it. According to hypothesis from Musiol 2014 [49] combination of antimicrobials lead to formation of new molecules to which germs are not yet adapted. This momentarily resolves the problem of resistance. With reference to results reported in Table 9. Diameters greatly exceed the sum of diameters of inhibition zones obtained with each of complexes tested alone. In the case of complexes (1+2) tested at a concentration of 1.5 mg/ml) against E. coli, zone inhibition diameter was about 13 mm, this suggested the synergistic effect. In other cases where diameters were inferior or equal to what obtained by the complex alone, the interaction seemed to be antagonistic (Table 10).
Table 9: Values of inhibition zone obtained with combination of two copper (II) complexes against E.coli
| Combination of copper complexes | Zone of inhibition (mm) produced by copper complexes against E. coli at a concentration of : | |||
|---|---|---|---|---|
| 6 mg/ml | 3 mg/ml | 1.5 mg/ml | 0.75 mg/ml | |
| Comp(1+2) | 12 | 13 | 13 | 11 |
| Comp(1+3) | 13 | 8 | 11 | 11 |
| Comp(2+3) | 13 | 11 | 11 | 10 |
Combination between two complexes and lactic acid
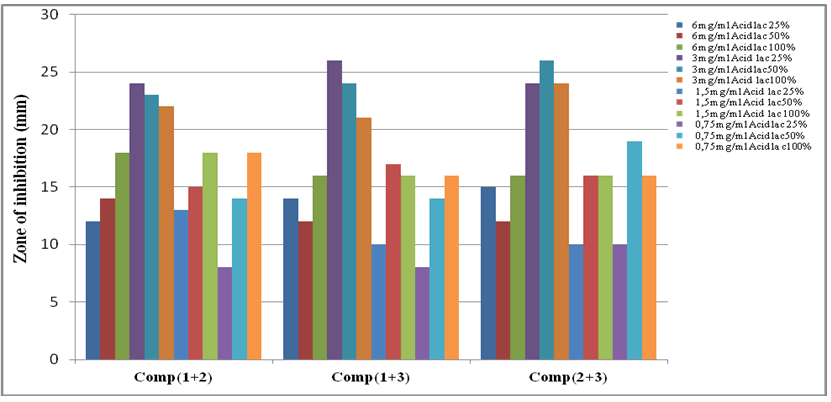
Combinations of lactic acid (organic acid) with copper complexes were performed assuming that their combined effect optimizes the antibacterial action. Indeed, we noticed that addition of lactic acid at concentrations ranging from (25% to 50%) to the complexes antibacterial activity of mixture is intense. Diameters of halos inhibition were higher than those obtained by using complexes separately and in combination [50-52]. This lead to synergistic effects probably due to chemical interactions between main components of copper complexes and lactic acid (Figure 20)1.
Table 10: Values combination of two copper (II) complexes and lactic acid against E. coli.
| Combination of copper | Zone of inhibition (mm) produced by copper complexes against E. coli at a concentration of : | |||||||||||
|---|---|---|---|---|---|---|---|---|---|---|---|---|
| Complexes and Acid lactic | 6 mg/ml | 3 mg/ml | 1.5 mg/ml | 0.75 mg/ml | ||||||||
| Acid lactic | 25% | 50% | 100% | 25% | 50% | 100% | 25% | 50% | 100% | 25% | 50% | 100% |
| Comp(1+2) | 12 | 14 | 18 | 24 | 23 | 22 | 13 | 15 | 18 | 8 | 14 | 18 |
| Comp(1+3) | 14 | 12 | 16 | 26 | 24 | 21 | 10 | 17 | 16 | 8 | 14 | 16 |
| Comp(2+3) | 15 | 12 | 16 | 24 | 26 | 24 | 10 | 16 | 16 | 10 | 19 | 16 |
According to Gong 2014, mechanisms by which lactic acid may kill sensitive bacteria are surface molecule(s) inactivation; disruption of integrity of bacterial outer membrane by reducing disulfides; and hydrogen ions entrance in bacteria disabling cellular metabolism essential for its development.
Conclusion
In this study, we synthesized successfully complex amino acids of copper (II). The structural determinations of their complexes were established by elemental analysis, UV, IR and (TD DFT) spectroscopy. In all complexes, the geometry around the copper (II) ions is octahedral. The electrochemical data show that the Cu (II) complexes had irreversible Cu (II)/Cu (I) coupling waves.
The antioxidant potential of the complexes was determined using a DPPH test. The experimental results showed that antioxidant activity of complexes 1 and 3 was good compared to ascorbic acid.
Results of antibacterial activity test revealed that all copper (II) complexes have significant antibacterial activity compared to ligands. These compounds were found to have inhibitory effect on growth of the two pathogenic bacterial strains tested (E. coli and S. aureus). Gram-negative bacterium E. coli was shown more sensitive thant Gram positive bacterium S. aureus. Copper complexes 2 and 3 showed good inhibition on E. coli and S. aureus strains (MIC of 3 mg/ml). The combination of lactic acid copper complexes enhanced antibacterial action leading to synergistic effect. Our findings suggested the possibilities of use of copper complexes or their combinations at industrial scale as additives for the preservation of food, and pharmaceutical, cosmetic or cleaning purposes.
References
- Choquesillo-Lazarte D, del Pilar Brandi-Blanco M, García-Santos I, et al. Coordination Chem Rev. 2008; 252(10-11):1241-1256.
- Lippert B. Coord Chem Rev. 2000; 200:487-516.
- Miller ER, Stowe HD, Ku PK, et al. 1979.
- Wagner CC, Torre MH, Baran EJ. Lat Am J Pharm.2008; 27(2):195-197.
- Baran EJ, Torre MH. Lat Am J Pharm. 2009; 28 (5):789-792.
- Hathaway B, Billing DE. Coord Chem Rev. 197; 5(2):143-207.
- Cotton FA, Wilkinson G, Murillo CA, et al. John Wiley and Sons, Inc.1999.[Google Scholar]
- Inorganica Q. Acta Farm. Bonaerense. 2000; 19(3):231-234.
- Sanchez?Moreno C, Larrauri JA, Saura?Calixto F. J Sci Food Agric. 1998; 76(2):270-276.
- Jin HZ, Hwang BY, Kim HS, et al. J Nat Prod. 2002; 65(1):89-91.
[Cross Ref] [Google Scholar] [Pubmed]
- Mensor LL, Menezes FS, Leitao GG, et al. Phytother Res. 2001; 15(2):127-130.
[Cross Ref] [Google Scholar] [Pubmed]
- De Pooter HL, Schamp N. Brunk, Walter de Gruyter, Berlin. 1986:139-50.
- Majhenic L, Skerget M, Knez Z. Food chem. 2007; 104(3):1258-1268..
- Nagababu P, Latha JN, Pallavi P, et al. Can J Microbiol. 2006; 52(12):1247-1254.
[Cross Ref] [Google Scholar] [Pubmed]
- Becke AD. Phys rev A. 1988; 38(6):3098.
[Cross Ref] [Google Scholar] [Pubmed]
- Lee C, Yang W, Parr RG. Phys rev B. 1988; 37(2):785.
[Google Scholar] [Pubmed]
- Morell C, Grand A, Toro-Labbé A. J Phys Chem A. 2005; 109 (1):205-12.
[Cross Ref] [Google Scholar] [Pubmed]
- Shavitt I. Mod theor chem.
- Hay PJ, Wadt WR. J Chem Phys. 1985; 82(1):299-310.
- Gorelsky SI, Lever AB. J Organomet Chem. 2001; 635 (1-2):187-96.
- Check CE, Faust TO, Bailey JM, etal. J Phys Chem A. 2001; 105 (34):8111-81116.
- Caetano EW, Fulco UL, Albuquerque EL, et al. J Phys Chem Solids. 2018; 121:36-48.
- Nakamoto K, MacCarthy PJ, McCarthy PJ. Wiley. 1968.
- Lever AB. J Electron Spectros Relat Phenomena. 1968.
- McAuliffe CA, Quagliano JV, Vallarino LM. Inorg Chem. 1966; 5(11):1996-2003.
- Ueno K, Martell AE. J Phys Chem. 1956; 60(9):1270-1275.
- Faniran JA, Patel KS, Bailar Jr JC. J Inorg nucl chem. 1974; 36(7):1547-1551.
- Asadi M, Jamshid KA, Kyanfar AH. Inorg Chim Acta. 2007; 360(5):1725-1730.
- Percy GC, Thornton DA. J Inorg nucl chem. 1973; 35(7):2319-2327.
- Procter IM, Hathaway BJ, Hodgson PG. J Inorg nucl chem. 1972; 34(12):3689-3697.
- Dunning TH, Hay PJ. Mod theor chem. 1976: 1-28.
- PJ H. J Chem Phys. 1985; 82(1):270-284.
- Cohen MD, Flavian S. J Chem Soc B: Phys Org. 1967:321-328.
- Gegiou D, Lambi E, Hadjoudis E. J Phys Chem. 1996; 100(45):17762-17765.
- Sorrell TN. Tetrahedron. 1989; 45 (1):3-68.
- Hathaway BJ, Wilkinson G, Gillard RD, et al. Coord Chem Rev. 1987;5:533-774.
- Alghool S. J Coord Chem. 2010; 63(18):3322-3333.
- Rahaman F, Mruthyunjayaswamy BH. Complex Metals. 2014; 1 (1):88-95.
- Parimala S, Gita KN, Kandaswamy M. Polyhedron. 1998; 17(19):3445-3453.
- Diouf O, Sall DG, Gaye ML, et al. Comptes Rendus Chimie. 2007; 10(6):473-481.
- Bard AJ, Faulkner LR, Brisset JL. Masson. 1983.
- Kumbhar AS, Padhye SB, West DX, et al. Transit Met Chem. 1991; 16 (2):276-279.
- DX West, AE Liberta, SB Padhye, et al. Coord Chem Rev 1993; 123:149.
- Lee JS, Kim HJ, Park H, et al. J Nat Prod. 2002; 65 (9):1367-1370.
[Cross Ref] [Google Scholar] [Pubmed]
- Yang CT, Moubaraki B, Murray KS, et al. Dalton Trans. 2003(5): 880-889.
- Joseyphus RS, Nair MS. Microbiol. 2008; 36(2):93-98.
[Google Scholar] [Pubmed]
- Fairlamb AH, Henderson GB, Cerami A. Proc Natl Acad Sci. 1989; 86 (8):2607-2611.
[Cross Ref] [Google Scholar] [Pubmed]
- Tumer M, Ekinci D, Tumer F, et al. Spectrochim Acta - A: Mol Biomol Spectrosc. 2007; 67 (3-4):916-929.
[Cross Ref] [Google Scholar] [Pubmed]
- Hemaiswarya S, Kruthiventi AK, Doble M. Phytomedicine. 2008; 15(8):639-652.
[Cross Ref] [Google Scholar] [Pubmed]
- Musiol R, Mrozek-Wilczkiewicz A, Polanski J. Curr Med Chem. 2014; 21(7):870-893.
[Cross Ref] [Google Scholar] [Pubmed]
- Gong Z, Luna Y, Yu P, et al. PloS one. 2014; 9(9):e107758.
[Cross Ref] [Google Scholar] [Pubmed]

