Original Articles: 2025 Vol: 17 Issue: 1
Measurement of Malondialdehyde in Plasma by High Performance Liquid Chromatography Assay in Severe Cranial Trauma at The First Week of Admission: Comatose Patients
Bahia Belatar1,2*, Aziz Bouklouse2, Yahya Cherrah2, Mourad Kharbach2, Issam Barra2, Nasreddine El Omari3, Nasreddine El Omari 1, Rokia Ghchime4,5,6, My Abbes Faouzi2, Wajdi Maazouzi1,7
1Department of Medicine and Pharmacy, Research Unit of Cerebral Monitoring in Neuro-Reanimation, Mohammed V University, Rabat, Morocco
2Department of Medicine and Pharmacy, Mohammed V University, Laboratory of Pharmacology and Toxicology, Pharmaceutical and Toxicological Analysis Research Team, Rabat, Morocco
3Department of Medicine and Pharmacy, Laboratory of Histology, Embryology and Cytogenetic, Mohammed V University, Rabat, Morocco
4Department of Clinical Neurophysiology, Hospital of Specialities, Ibn Sina University Hospital, Rabat Institut 6220, Rabat, Morocco
5Department of Medicine and Pharmacy, Epilepsies and Neuromuscular Diseases Research Team, Neuroscience Center, Mohammed V University, Rabat, Morocco
6Department of Medicine, Unit of Cardiology A, Ibn Sina University Hospital, Rabat, Morocco
7Department of Medicine, Service of Anesthesiology and Reanimation, Hospital of specialties, Ibn Sina University Hospital, Rabat, Morocco
- Corresponding Author:
- Bahia Belatar
Department of Medicine and Pharmacy,
Research Unit of Cerebral Monitoring in Neuro-Reanimation, Mohammed V University
Rabat,
Morocco
Received: 02-Feb-2024, Manuscript No. JOCPR-24-126536; Editor assigned: 05-Feb-2024, PreQC No. JOCPR-24-126536 (PQ); Reviewed: 19-Feb-2024, QC No. JOCPR-24-126536; Revised: 03-Mar-2025, Manuscript No. JOCPR-24-126536 (R); Published: 10-Mar-2025, DOI:10.37532/0975-7384.2025.17(1).230.
Citation: Belatar B. 2025. Measurement of Malondialdehyde in Plasma by High Performance Liquide Chromatography Assay in Severe Cranial Trauma at the First Week of Admission: Comatose Patients. J. Chem. Pharm. Res., 17:230.
Copyright: © 2025 Belatar B, et al. This is an open-access article distributed under the terms of the Creative Commons Attribution License, which permits unrestricted use, distribution, and reproduction in any medium, provided the original author and source are credited.
Abstract
Introduction: Lipid peroxidation is one of the most commonly reported index for the oxidative stress. Reactive oxygen species mediated oxidation of membrane lipids results in the formation of lipid peroxidation products such as malondialdehyde. Several authors reported that the Malondialdehyde (MDA) has been found higher in various diseases related to free radical damage, and it has been widely used as an index of lipoperoxidation in biological and medical sciences.
Methods: The case-control study was conducted on 23 comatose patients with Traumatic Brain Injury (TBI), in the Department of Anesthesiology and Reanimation, Ibn Sina University Hospital and Hospital of specialties in Rabat-Morocco. Blood sampling was collected from TBI patients, in the first week (3 h after admission and each 48 h during one week). Concentration of MDA in plasma was quantified using a high-performance liquid chromatography technique. Statistical analysis was performed by Statistical software (SPSS) and the cases were compared using the Mann–Whitney U-test. A p-value <0.05 was considered to be statistically significant.
Results: The difference of plasmatic MDA concentration between men and women were not revealed a statistical significance. Similar concentration of MDA in patients according to the survival and the unsurvival status showed (not presented a statistical significance (p>0.05).
Conclusion: The MDA may not play an important role in the patients’ death from severe traumatic brain injury during the first week of hospitalization.
Keywords
Severe brain injury, Comatose patients, Malondialdehyde, Admission, Oxidative stress
Introduction
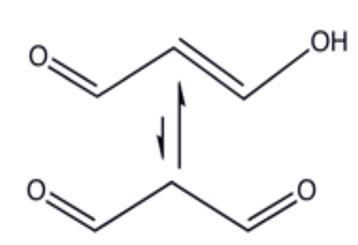
Oxidative stress known to be a component of molecular and cellular tissue damage mechanisms in a wide spectrum of human diseases [1]. Several oxygenated compounds, particularly aldehydes such as Malondialdehyde (MDA) and conjugated dienes, were produced during the attack of free radicals to membrane lipoproteins and polyunsaturated fatty acids. Lipid peroxidation was one of the most commonly reported index of the oxidative stress [2]. Malondialdehyde (MDA) was one of the major secondary oxidation products of peroxidized polyunsaturated fatty acids and showed a biological significance [3-5]. Since MDA has been found higher in various diseases related to free radical damage. It has been widely used as an index of lipoperoxidation in biological and medical sciences [6,7]. After Traumatic Brain Injury there is an increase in the production of Reactive Oxygen Species (ROS) and they were involved in the secondary brain injury contributing to cellular dysfunction, loss of microvascular regulation, vasogenic edema, and progressive post traumatic ischemia [8]. The increase of ROS leads to lipid peroxidation and Malondialdehyde (MDA) is an end-product formed during this lipid peroxidation, due to degradation of cellular membrane phospholipids [8]. Malondialdehyde it has been used as an effective biomarker of lipid oxidation in other clinical circumstances as sepsis [9,10]. The lipids oxides are all measurable in biological fluids and the analytical methods used are sometimes complex and require preliminary extraction and purification phases, numerous assay techniques have been developed over the last few years. Some, such as gas chromatography or liquid chromatography coupled with mass spectrometry are the reference techniques, and require a lot of equipment. Others, such as immunological techniques, they are simpler to implement and accessible to a greater number of laboratories but still lack specificity [11]. The analytical approaches based on the resolution of the MDA- TBA2 condensation product using a High-Performance Liquid Chromatography (HPLC) coupled to UV-Vis and Mass Spectrometry (MS) detections [12-15]. Capillary Electrophoresis (CE) with fluorescence detection were also used [16]. The MDA assayed by the MDA-HPLC method based on the procedure described by Nielsen, et al. [17]. The work aimed to develop a new method for the quantification of MDA in plasma. The method was developed and validated in order to apply to the plasma sampling of comatose patients suffering from severe cranial trauma during their first week of hospitalization (Figure 1).
Figure 1: MDA chemical structure (C3H4O2).
Materials and Methods
Patients: This study was conducted on 64 comatose patients with severe TBI. Patients included in this study were recruited in the Department of Anesthesiology and Reanimation, Ibn Sina University Hospital and Hospital of specialties in Rabat, Morocco. We studied 23 comatose patients with severe Traumatic Brain Injury (TBI). 21 men aged between 20 and 55 years old and 2 women aged 49 and 62 years old.
Inclusion criteria: cases included in this study were comatose patients with severe TBI aged from 18 to 64 years old. Neurological symptoms of severe TBI were confirmed by MRI/CT-scan.
Exclusion criteria: patients excluded from the study were smokers, alcoholics, receiving barbiturates medication, corticoids or any treatment that could have an antioxidant effects and patients who underwent a craniotomy, with febrile state and/or septic shock state and psychological problems.
Blood sampling and storing conditions: 4 ml of Peripheral venous blood was collected from patients in EDTA tubes within the first week. Blood samples were centrifuged at 4.000 rpm/min for 15 min at 4°C, and then plasma samples were aliquoted and stored at -80°C for later determination MDA concentration.
Statistical analysis: Statistical analysis was performed using Statistical software (SPSS). A p-value<0.05 was considered to be statistically significant.
Chemicals and reagents
N-butanol, phosphoric acid, ultrapure water from the standard solution of MDA (6 M), standard solutions wereprepared in water, to obtain a range concentration from 0,093 to 1,5 μg/mL. A 42 mM solution of TBA was prepared,6 mg of TBA per 1 mL of ultrapure water (for rapid dissolution, the tube is deceived for a few seconds in the bath at 95°C). The sample of human blood free was used as a biological matrix during the development of the methoddelivered by the hospital of specialties and hospital IBN SINA of Rabat, Morocco.
Instrumentation and chromatographic conditions
High Performance Liquid Chromatography (HPLC) was a chromatographic system (Dionex/680 HPLC series) equipped with an automatic injector (ASI-100), a quaternary pump (P680) and a diode array detector. The Dionex chromatographic chain is equipped with an automatic feeder, a thermostatic column oven set at 30°C. The compartment where the injection solutions placed was kept at a temperature of 8°C to prevent degradation of the plasma samples; the detector was set at 530 nm, the column was a reverse phase C18, (150 mm × 4.6 mm × 5 μm, id). The mobile phase is composed of 100 mM Acetonitrile/Phosphate buffer (KH2PO4) (pH 6.8) in proportions 25/75 (v/v). The flow rate was set at 0.6 mL/min.
Extraction
We put in a glass tube with a stopper in the order; test portion: 100 μL of plasma sample or standard MDA, or the control (ultra-pure water) TBA: 300 μL 1% phosphoric acid, 700 μL thoroughly vortex and put the tubes at 95°C for 30 min, then the reaction stopped by putting the tubes of ice 1.1 mL of n-butanol were added, the tubes were well vortexed and then centrifuged at 3000 rpm. The supernatant (100 μL) were injected into the chromatographic system.
Results and Discussion
Validation of the method
The validation was carried out according to the "analytical validation guideline" published at the STP pharma practice journal (3), and the guidelines of the ICH Q2R1 (4). The following criteria was tested such as selectivity, linearity, fidelity (repeatability), accuracy, detection and quantification limits.
Specificity
The specificity of an analytical method consists in showing that the measured peak comes only from the compound to be analyzed, without any interference with its matrix (excipients, degradation products, impurities, etc.). The study of the specificity of the method involves the comparison made on the chromatograms of the reconstituted pharmaceutical form and the placebo.
An analytical procedure is said to be specific when it ensures that the measured signal comes only from the analyte.
White: consists of virgin plasma eluted by the mobile phase.
No peak on the placebo chromatogram should elute at the same retention time as the standard solution.
No signal was observed for the retention time of MDA in the non-overloaded control plasma. No peak is retained at this retention time when the blank is injected.
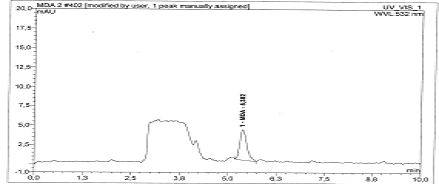
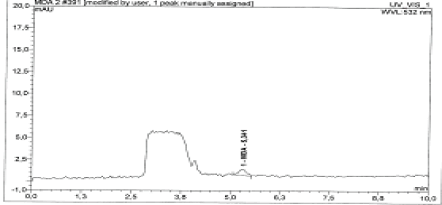
Selectivity: Selectivity was studied according to the validation standard, the extraction of a blood sample at their respective retention times is (5.34 ± 0.02) (Figures 2 and 3).
Figure 2: Malondialdehyde in severe head trauma.
Figure 3: Malondialdehyde in the healthy subjects.
Linearity
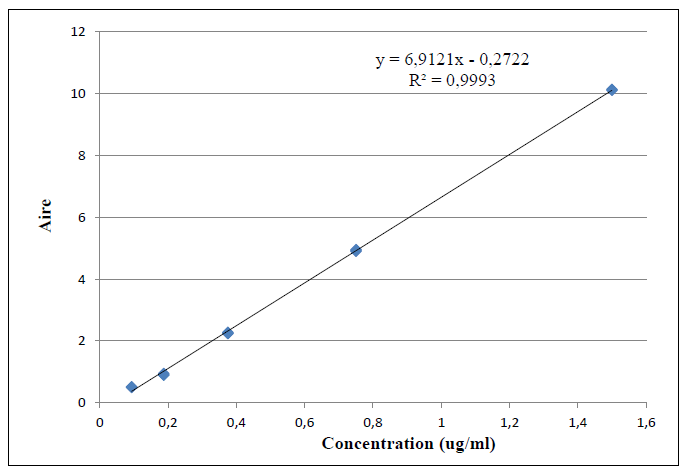
Linearity is the ability to obtain within a certain range results directly proportional to the concentration of the analyte in a sample. The linearity of a procedure was the ability within the assay range to provide results directly proportional to the concentration. It was carried out according to the SFSTP and ICH criteria at 5 different levels corresponding respectively to 0.093, 0.187, 0.375, 0.75 and 1.5 μg/mL prepared by dilution from the stock solution of 1 mg/mL in plasma, after extraction.
The correlation coefficient R2=0.9995 was greater than 0.99. Statistical validation tests of linear regression were conclusive at alpha risk of 5%. The values obtained by the statistical analysis of the linearity make it possible to conclude that the method was linear in the selected dosing interval. A series of 6 corresponding tests at the concentration level of 0.75 μg/mL was prepared from the stock solution of MDA (6M), then they are injected into the chromatographic system. The calibration line is drawn by plotting the MDA areas of the three repetitions by concentration level and by day as a function of concentration (Figure 4).
Figure 4: Calibration curve of Malondialdehyde.
The calibration line is plotted by averaging the MDA area averages of the three repetitions by concentration level and day as a function of concentration. The slope was significant and the intercept was also significant. Since the intercept was not different from zero, the calculations of the found values were calculated from the following equation y=bx-a.
Repeatability
The repeatability was carried out on a concentration of the assay interval (0.75 μg/mL) with six repetitions, the procedure is carried out on three different days under the same operating conditions.
Acceptance criteria: The coefficient of variation must be less than 15% according to the MDA in biological matrices. (A.B).
Conclusion: Coefficient of Variation (CVs) was less than 15%. It was concluded that the method was repeatable (Table 1).
| m+t*S/√N | 104,5529 |
| m-t*S/√N | 101,4253 |
| Coefficient of variation of repeatability | 0,1% |
| Coefficient of variation of intermediate precision | 1,8% |
Table 1: Fidelity study.
Intermediate precision
This creteria was performed on three independent series at different concentration. The coefficient of variation (CvR %) 1.8% is less than 15% recommended by the ICH guideline in biological (Table 2) which confirms the precision of the method.
| Cvr= | 0,1% |
| CvR= | 1,8% |
| CV global | 1,5% |
Table 2: Test of the existence of a significant slope.
Accuracy
The accuracy corresponds to the degree of agreement between the value of the method obtained and the reference value. The principle of accuracy is to calculate the recovery values in% between the quantities found and the quantities introduced (Table 3).
| Trial | Quantity introduced µg/ml | Recovery % | Average recovery |
| 1 | 0,093 | 107,56 | 107,71 |
| 1 | 0,093 | 107,87 | |
| 1 | 0,093 | 107,71 | |
| 2 | 0,187 | 104,37 | 104,29 |
| 2 | 0,187 | 104,37 | |
| 2 | 0,187 | 104,14 | |
| 3 | 0,375 | 101,72 | 101,74 |
| 3 | 0,375 | 101,75 | |
| 3 | 0,375 | 101,74 | |
| 4 | 0,75 | 100,79 | 100,79 |
| 4 | 0,75 | 100,80 | |
| 4 | 0,75 | 100,79 | |
| 5 | 1,5 | 100,38 | 100,38 |
| 5 | 1,5 | 100,38 | |
| 5 | 1,5 | 100,38 |
Table 3: Parameters for accuracy.
The 100% was not within the range, consequently the method was not exact. The validated plasma MDA assay will allow us to quantify MDA in severe coma head trauma.
Fidelity
The fidelity of the analysis procedure expresses the narrowness of the agreement between a series of measurements coming from multiple samplings of the same homogeneous sample under prescribed conditions. It is expressed by the measure of repeatability and intermediate fidelity. Repeatability refers to tests of the same size performed under conditions as stable as possible.
Limit of detection and quantification
The detection limit corresponds to the concentration allowing to obtain a peak of amplitude greater than or equal to three times that of background noise and the limit of quantification.
|
Detection limit |
0,01705 |
|
Quantification limit |
0,05165 |
Table 4: Limit of Detection (LOD) and Limit of Quantification (LOQ).
The method of determination of MDA developed from blood samples loaded using HPLC as a technique, proves to be sufficiently sensitive, precise, specific and accurate. It may be used successfully for the quantification of the MDA in the human blood samples from patients with head injury in coma at admission.
Clinical study
In our study, most of traumatic brain injury cases received in the hospital were men (89.1%) and only 10.9% of patients were women. Our data has shown that the main type of severe traumatic brain injury was brain injury type (71.9%). The other types of severe TBI were respectively 21.9% and 6.3% for hemorrhagic stroke and ischemic stroke. The death rate in patients was relatively high (60.9%) compared to survival rate which was 39.1% only. The Glasgow coma scale scores were collected in three days within admission. In fact, all patients in the first day showed severe score of GCS. In the third day after admission, 90.9% had severe GCS score compared to 9.1% of moderate scores. In the fifth day GCS score were also 81.81% severe and 18.19% moderate.
The HPLC method was adapted for use with the human plasma. The major advantage of this method was its high reproducibility, selectivity and sensitivity for the determination of MDA. By use of this method very small quantities of MDA can be readily and specifically detected in different plasma, we have developed a sensitive, simple, and rapid method applicable to the determination of MDA in human plasma.
The difference of plasmatic MDA concentration in patients with TBI were compared according to survival status and gender; the data did not show a difference between survived and un-survived patients. In a similar investigation, higher serum levels of MDA were found in patients with TBI compared in controls [11,12]. Also, higher levels of MDA in erythrocytes or serum were found in non-surviving patients than in surviving TBI patients [13-16]. On the other hand, no statistical significance of MDA concentration in patients was showed according to gender (Table 5), and no statistically significant correlation between clinical parameters and Malondialdehyde at day 0 and day 2 (Table 6). In fact, MDA levels were found to be independent of gender but strongly correlated to age in healthy subjects [17]. However, another data showed that Plasmatic MDA concentrations in healthy subjects (without chronic hypertension, renal or metabolic disease) were significantly higher in men. Additionally, young men had greater MDA concentrations than the postmenopausal and premenopausal women [18].
| Variable | Women (n=2) | Men (n=21) | |
| MDA (µmol/L) | 0.07 (0.06 ;.) | 0.07 (0.06 ; 0,1) | 0.35 |
| Un-survived (n=15) | Survived (n=8) | ||
| MDA (µmol/L) | 0.07 (0.06 ; 0,1) | 0.07 (0.06 ; 0.09) | 0.84 |
Table 5: Plasmatic MDA concentration in patients according to gender and the survival and the death status.
|
|
Gly j0 |
Gly j2 |
Gly j4 |
Crtj0 |
Crtj2 |
Crtj4 |
pHJ0 |
|
MDA |
|||||||
|
day 0 |
0,32 |
0,10 |
-0,80 |
0,05 |
0,10 |
0,80 |
0,54 |
|
0,21 |
0,72 |
0,20 |
0,85 |
0,79 |
0,20 |
0,34 |
|
|
RHO |
|
|
|
|
|
|
|
|
P-value |
|
|
|
|
|
|
|
|
MDA |
|||||||
|
day 2 |
0,19 |
-0,56 |
0,00 |
-0,06 |
0,18 |
0,00 |
0,54 |
|
0,59 |
0,18 |
1,00 |
0,86 |
0,69 |
1,00 |
0,34 |
|
|
RHO |
|
|
|
|
|
|
|
|
P-value |
|
|
|
|
|
|
|
|
Note: Gly: Glycemia, Crt: Creatinine |
|||||||
Table 6: Correlation between clinical parameters and MDA at day 0 and day 2.
Conclusion
MDA may not play a role in death of patients from severe traumatic brain injury during the first week of hospitalization.
In the present study, the difference of plasmatic MDA concentration between men and women were not revealed a statistical significance. Same as the concentration of MDA in patients according to the survival and the un-survival status (no statistical significance showed (p>0.05)).
References
- Braughler JM, et al. Free Radic Biol Med. 1989;6(3):289-301.
[Crossref] [Google Scholar] [PubMed]
- Watson BD, et al. J Neurochem. 1984;42(1):268-274.
[Crossref] [Google Scholar] [PubMed]
- Capral-Gautier J, et al. STP Pharma pratiques. 1992;2(4):205-226.
- Singh J, et al. J Pharmacol Pharmacother. 2015;6(3):185-187.
- Kil HY, et al. J Cereb Blood Flow Metab. 1996;16(1):100-106.
[Crossref] [Google Scholar] [PubMed]
- Zhang J, Neurosci Lett. 1994;177(1-2):127-130.
[Crossref] [Google Scholar] [PubMed]
- Morimoto T, J Cereb Blood Flow Metab. 1996;16(1):92-99.
[Crossref] [Google Scholar] [PubMed]
- Lorente L. Arch Trauma Res. 2015;4(4):e30165.
[Crossref] [Google Scholar] [PubMed]
- Lorente L, et al. PLoS One. 2013;8(1):e30165.
[Crossref] [Google Scholar] [PubMed]
- Lorente L, et al. J Crit Care. 2015;30(4):860.e1-e6.
[Crossref] [Google Scholar] [PubMed]
- Michel F, et al. Ann Biol Clin. 2008;66(6):605-620.
- Grotto D, et al. J Pharm Biomed Anal. 2007;43:619-624.
[Crossref] [Google Scholar] [PubMed]
- Moselhy HF, et al. J Lipid Res. 2013;54(3):852-858.
[Crossref] [Google Scholar] [PubMed]
- Karatas F, et al. Anal Biochem. 2002;311(1):76-79.
[Crossref] [Google Scholar] [PubMed]
- Bastos AS, et al. Anal Biochem. 2012;423(1):141-146.
[Crossref] [Google Scholar] [PubMed]
- Cooley JC, et al. Electrophoresis. 2011;32(21):2994-2999.
[Crossref] [Google Scholar] [PubMed]
- Nielsen F, et al. Clin Chem. 1997;43(7):1209-1214.
[Google Scholar] [PubMed]
- Powers RW, et al. Metabolism. 2002;51(11):1433-1438.
[Crossref] [Google Scholar] [PubMed]


