Original Articles: 2023 Vol: 15 Issue: 5
Eco-Friendly Natural Flowers as Indicators in Acid-Base Titrations
Sashikala S*, Pooja S, Pavithra A, Priya V
Department of Chemistry, D.K.M. College for Women, Tamil Nadu, India
- Corresponding Author:
- Sashikala S
Department of Chemistry,
D.K.M. College for Women,
Tamil Nadu,
India
Received: 30-Mar-2023, Manuscript No. JOCPR-23-93647; Editor assigned: 03-Apr-2023, PreQC No. JOCPR-23-93647 (PQ); Reviewed: 17-Apr-2023, QC No. JOCPR-23-93647; Revised: 23-May-2023, Manuscript No. JOCPR-23-93647 (R); Published: 30-May-2023, DOI:10.37532/0975-7384.2023.15(5).043.
Citation:Sashikala S, et al. 2023. Eco-Friendly Natural Flowers as Indicators in Acid-Base Titrations. J. Chem Pharm. Res., 15:043.
Copyright: © 2023 Sashikala S, et al. This is an open-access article distributed under the terms of the Creative Commons Attribution License, which permits unrestricted use, distribution, and reproduction in any medium, provided the original author and source are credited.
Abstract
The commonly used indicators for acid-base titrations are synthetic, namely phenolphthalein/methyl orange. But there are some obstacles like environmental pollution, availability and higher cost which lead to utilization for herbal compounds as acid base indicators. Hence this work was aimed to identify the eco-friendly natural indicators using some flowers. The potential of the flowers is very promising as seen in acid-based titrimetry at room temperature. Flower extract indicators which were used in acid-base titrations show sharp color changes at the equivalence point. The result proved to be acceptable in introducing natural pigments as suitable acid-base indicators. These natural indicators are found to be a very helpful, inexpensive, simple, accurate and nature friendly.
Keywords
Acid-base titration, Synthetic indicators, Flower petal extracts natural indicator, Phenolphthalein, Methyl orange
Introduction
Synthetic indicators had continuously been the first choice for all types of acid-base titrations since long time [1]. However, due to certain disadvantages like high cost, availability problems and environmental pollution, an attempt is required to replace synthetic indicators with natural indicators [2-7].
Literature survey revealed that, many researchers have conducted studies on isolation, separation and characterization of compounds present in plants and animals and they also studied the extractions procedures, optimization of extraction conditions to get pure and maximum yield of naturally occurring compounds from different parts of plants [8].
Titration or titrimetry is a general laboratory method of quantitative chemical analysis which can be observed from the quantity of a liquid of standard solution, the titrant or the solution of known concentration, to convert the constituent into another form. A change of color or the formation is used to determine the concentration of an analyte, titrand or unknown solution [9].
Materials and Methods
Reagents: Analytical grade (AR) of hydrochloric acid, sodium hydroxide, acetic acid, ammonium hydroxide, phenolpthalein and methly orange were used. All the volumetric solutions and reagents were prepared as per Indian Pharmacopoeia, IP 1996 [10].
Flower petal materials: Fresh flowers (hibiscus, butterfly pea, banana flower, purple allamanda, African marigold and chrysanthemum) were collected from the nearby villages around Vellore district, Tamilnadu, India. And were identified from the botany department of D.K.M. college for women, Vellore [11].
Glass wares: Standard flasks, burettes, pipettes, conical flasks, beakers, glass rods and funnel were used to carry out the experiment [12-14].
Preparation of flower petal extracts: The flowers were thoroughly washed with distilled water, cut in small pieces placed in a mortar and then macerated using the pestle. It was then transferred into a 250 ml iodine flask containing 100 ml absolute methanol and was kept in a cupboard away from light for 24 hrs for proper extraction. After which the content was filtered and the clear filtrate was collected for the titration. The clear filtrate from extraction was used as natural indicator, while phenolphthalein and methyl orange like synthetic indicators were used as standard [15].
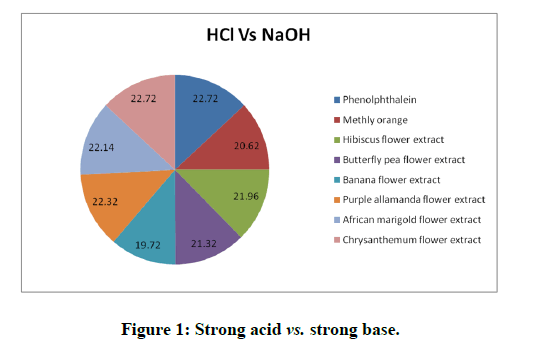
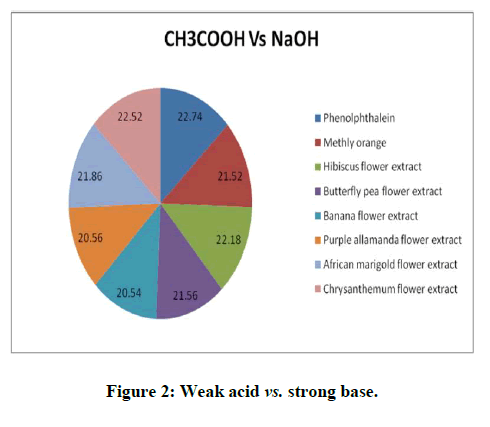
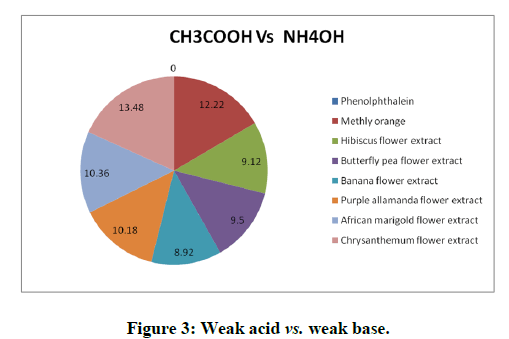
Titrations: 1 ml of the extract of hibiscus, butterfly pea, banana flower, purple allamanda, African marigold and Chrysanthemum (taken separately in different conical flasks) was added as an indicator for all the type of titrations such as strong acid (HCl) against strong base (NaOH), strong acid (HCl) against weak base (NH4OH), weak acid (CH3COOH) against strong base (NaOH) and the trials were repeated five times to check the precision. The titrations were again carried out using the standard (synthetic) indicators phenolphthalein and methyl orange. The results obtained were compared with the results of titrations using the natural indicator. Titration results were depicted in the Tables 1 to 3 and Figures 1 to 3 [16].
Results and Discussion
The titration results showed that the end point of the titration of strong acid against strong base (HCl vs. NaOH), weak acid against strong base (CH3COOH vs. NaOH) and weak acid against weak base (CH3COOH vs. NH4OH using the natural indicator either coincide or almost reached close to the end point obtained by the standard indicator phenolphthalein or methly orange and it give sharp colour change at the end point. The titration of strong acid against weak base (HCl vs. NH4OH) using the natural indicator didn’t give a sharp color change whereas the standard indicator give a sharp color change [17].
| Indicator | Volume of acid (ml) | Burette reading (ml) | Volume of titrant, mean value (ml) | Colour change | Mean ± std. dev. of the titer value (ml) | |
|---|---|---|---|---|---|---|
| Initial | Final | |||||
| Phenolphthalein | 20 | 0 | 22.7 | 22.72 | Colourless to pink | 22.72 ± 0.045 |
| 20 | 0 | 22.7 | ||||
| 20 | 0 | 22.8 | ||||
| 20 | 0 | 22.7 | ||||
| 20 | 0 | 22.7 | ||||
| Methly orange | 20 | 0 | 20.7 | 20.62 | Red to pink | 20.62 ± 0.045 |
| 20 | 0 | 20.6 | ||||
| 20 | 0 | 20.6 | ||||
| 20 | 0 | 20.6 | ||||
| 20 | 0 | 20.6 | ||||
| Hibiscus flower extract | 20 | 0 | 22 | 21.96 | Red to pink | 21.96 ± 0.089 |
| 20 | 0 | 21.9 | ||||
| 20 | 0 | 21.9 | ||||
| 20 | 0 | 21.9 | ||||
| 20 | 0 | 22.1 | ||||
| Butterfly pea flower extract | 20 | 0 | 21.4 | 21.32 | Pink to blue | 21.32 ± 0.045 |
| 20 | 0 | 21.3 | ||||
| 20 | 0 | 21.3 | ||||
| 20 | 0 | 21.3 | ||||
| 20 | 0 | 21.3 | ||||
| Banana flower extract | 20 | 0 | 19.8 | 19.72 | Orange to Colourless | 19.72 ± 0.045 |
| 20 | 0 | 19.7 | ||||
| 20 | 0 | 19.7 | ||||
| 20 | 0 | 19.7 | ||||
| 20 | 0 | 19.7 | ||||
| Purple allamanda flower extract | 20 | 0 | 22.3 | 22.32 | Red to green | 22.32 ± 0.045 |
| 20 | 0 | 22.3 | ||||
| 20 | 0 | 22.4 | ||||
| 20 | 0 | 22.3 | ||||
| 20 | 0 | 22.3 | ||||
| African marigold flower extract | 20 | 0 | 22.1 | 22.14 | Yellow to orange | 22.14 ± 0.089 |
| 20 | 0 | 22.1 | ||||
| 20 | 0 | 22.1 | ||||
| 20 | 0 | 22.1 | ||||
| 20 | 0 | 22.3 | ||||
| Chrysanthemum flower extract | 20 | 0 | 22.7 | 22.72 | Green to Yellow | 22.72 ± 0.045 |
| 20 | 0 | 22.7 | ||||
| 20 | 0 | 22.7 | ||||
| 20 | 0 | 22.7 | ||||
| 20 | 0 | 22.8 | ||||
Table 1: Titration of HCl vs. NaOH using methanol extract of hibiscus, butterfly pea, banana flower, purple allamanda, African marigold and chrysanthemum.
| Indicator | Volume of acid (mL) | Burette reading (mL) | Volume of titrant, mean value (mL) | Colour change | Mean ± std. dev. of the titer value (mL) | |
|---|---|---|---|---|---|---|
| Initial | Final | |||||
| Phenolphthalein | 20 | 0 | 22.7 | 22.74 | Colourless to pink | 22.74 ± 0.055 |
| 20 | 0 | 22.7 | ||||
| 20 | 0 | 22.7 | ||||
| 20 | 0 | 22.8 | ||||
| 20 | 0 | 22.8 | ||||
| Methly orange | 20 | 0 | 21.5 | 21.52 | Red to orange | 21.52 ± 0.045 |
| 20 | 0 | 21.5 | ||||
| 20 | 0 | 21.5 | ||||
| 20 | 0 | 21.5 | ||||
| 20 | 0 | 21.6 | ||||
| Hibiscus flower extract | 20 | 0 | 22.2 | 22.18 | Red to yellowish green | 22.18 ± 0.045 |
| 20 | 0 | 22.2 | ||||
| 20 | 0 | 22.1 | ||||
| 20 | 0 | 22.2 | ||||
| 20 | 0 | 22.2 | ||||
| Butterfly pea flower extract | 20 | 0 | 21.6 | 21.56 | Violet to blue | 21.56 ± 0.089 |
| 20 | 0 | 21.6 | ||||
| 20 | 0 | 21.6 | ||||
| 20 | 0 | 21.4 | ||||
| 20 | 0 | 21.6 | ||||
| Banana flower extract | 20 | 0 | 20.5 | 20.54 | Yellow to colourless | 20.54 ± 0.089 |
| 20 | 0 | 20.7 | ||||
| 20 | 0 | 20.5 | ||||
| 20 | 0 | 20.5 | ||||
| 20 | 0 | 20.5 | ||||
| Purple allamanda flower extract | 20 | 0 | 20.6 | 20.56 | Orange to yellow | 20.56 ± 0.089 |
| 20 | 0 | 20.4 | ||||
| 20 | 0 | 20.6 | ||||
| 20 | 0 | 20.6 | ||||
| 20 | 0 | 20.6 | ||||
| African marigold flower extract | 20 | 0 | 21.9 | 21.86 | Orange to red | 21.86 ± 0.089 |
| 20 | 0 | 21.9 | ||||
| 20 | 0 | 21.7 | ||||
| 20 | 0 | 21.9 | ||||
| 20 | 0 | 21.9 | ||||
| Chrysanthemum flower extract | 20 | 0 | 22.5 | 22.52 | Green to yellow | 22.52 ± 0.045 |
| 20 | 0 | 22.5 | ||||
| 20 | 0 | 22.5 | ||||
| 20 | 0 | 22.5 | ||||
| 20 | 0 | 22.6 | ||||
Table 2: Titration of CH3COOH vs. NaOH using aqueous extract of hibiscus, butterfly pea, banana flower, purple allamanda, African marigold and chrysanthemum.
| Indicator | Volume of acid (ml) | Burette reading (ml) | Volume of titrant, mean value(ml) | Colour change | Mean ± std. dev. of the titer value (ml) | |
|---|---|---|---|---|---|---|
| Initial | Final | |||||
| Phenolphthalein | 20 | 0 | - | No proper change | ||
| 20 | 0 | - | ||||
| 20 | 0 | - | ||||
| 20 | 0 | - | ||||
| 20 | 0 | - | ||||
| Methly orange | 20 | 0 | 12.2 | 12.22 | Yellow to red | 12.22 ± 0.045 |
| 20 | 0 | 12.2 | ||||
| 20 | 0 | 12.3 | ||||
| 20 | 0 | 12.2 | ||||
| 20 | 0 | 12.2 | ||||
| Hibiscus flower extract | 20 | 0 | 9.1 | 9.12 | Pink to yellow | 9.12 ± 0.045 |
| 20 | 0 | 9.1 | ||||
| 20 | 0 | 9.2 | ||||
| 20 | 0 | 9.1 | ||||
| 20 | 0 | 9.1 | ||||
| Butterfly pea flower extract | 20 | 0 | 9.5 | 9.5 | Violet to blue | 9.5 ± 0.000 |
| 20 | 0 | 9.5 | ||||
| 20 | 0 | 9.5 | ||||
| 20 | 0 | 9.5 | ||||
| 20 | 0 | 9.5 | ||||
| Banana flower extract | 20 | 0 | 9 | 8.92 | Yellow to Colourless | 8.92 ± 0.045 |
| 20 | 0 | 8.9 | ||||
| 20 | 0 | 8.9 | ||||
| 20 | 0 | 8.9 | ||||
| 20 | 0 | 8.9 | ||||
| Purple allamanda flower extract | 20 | 0 | 10.1 | 10.18 | Pink to colourless | 10.18 ± 0.045 |
| 20 | 0 | 10.2 | ||||
| 20 | 0 | 10.2 | ||||
| 20 | 0 | 10.2 | ||||
| 20 | 0 | 10.2 | ||||
| African marigold flower extract | 20 | 0 | 10.2 | 10.36 | Orange to light green | 10.36 ± 0.089 |
| 20 | 0 | 10.4 | ||||
| 20 | 0 | 10.4 | ||||
| 20 | 0 | 10.4 | ||||
| 20 | 0 | 10.4 | ||||
| Chrysanthemum flower extract | 20 | 0 | 13.5 | 13.48 | Green to colourles | 13.48 ± 0.045 |
| 20 | 0 | 13.5 | ||||
| 20 | 0 | 13.5 | ||||
| 20 | 0 | 13.5 | ||||
| 20 | 0 | 13.4 | ||||
Table 3: Titration of CH3COOH vs. NH4OH using aqueous extract of hibiscus, butterfly pea, banana flower, purple allamanda, African marigold and chrysanthemum.
CONCLUSION
The natural indicators extracted from the flower petals was found to be a potential substitute for methyl orange or phenolphthalein for titrations of strong acid versus weak base and strong acid versus strong base. Hence, the flower petal extract as a natural indicator is found to be a very useful, readily available, non-hazardous, economical, simple to prepare and accurate for the acid-base titrations.
References
- Margrat Sheela S, Rosaline Vimala J, Mahalakshmi NV, et al. Int J Sci Res Rev. 2019;8(5):338-344.
- Kar A. Pharmaceutical drug analysis. 2nd edition. New age international (P) limited publishers. New Delhi, India. 2005.
- Sharma P. Planta Med. 2013;2:1-2.
- Arsia TY, Sahith N. Int J Allied Med Sci Clin Res. 2014;2:169-176.
[Crossref]
- Sharma P, Gupta R, Roshan S. Planta Med. 2013;3:1-3.
- Deshpande A. J Pharm Res. 2010;3(10):2512-2513.
- Vyas A. Int J Pharm Sci. 2012;3(3):2211-2221.
- Tzur D, Kirowa-Eisner E. Anal Chim Acta. 1997;355(1):85-93.
- Pathan MAK, Farooqui M. J Adv Sci Res. 2011;2(4):20-27.
- Eze SO, Ogbuefi RA. Asian J Appl Sci. 2014;3(1):54-60.
- Bhuvaneshwari B, Sivaelango G, Parthiban D, et al. Res J Pharmacogn Phytochem. 2015;7(2):65.
- Rajamurugan R, Thirunavukkarasu C, Sakthivel V, et al. Int J Pharma Bio Sci. 2013;4(2):124-130.
- Vinayak SM, Shrikant SK, Suresh GK, et al. Asian J Biomed Pharm Sci. 2013;3:10-13.
- Kapilraj N, Keerthanan S, Sithambaresan M. J Chem. 2019.
- El-Samahy S, El-Hady E, Habiba R, et al. J Prof Assoc Cactus Dev. 2006:39-51.
- Sandeep BP, Kondawar MS, Ghodke DS, et al. Res J Pharm Technol. 2009;2:421-422.
- Arsia TY, Sahith N. Int J Allied Med Sci Clin Res. 2014;2:169-176.


